Trading Strategies
Strategies and indicators available in Trend Analyser, with help on special indicators and general trading setups.
The strategies available in Trend Analyser are shown below in detail. You will also find help on special indicators found in TA along with general trading setups. We have created advanced trading strategies, indicators and scanning tools in the script editor. You will find detailed explanations here.
Strategy
Looking for stock market analysis tools? Check out our best day trading strategies that can help you make profit in the stock market.
C9 Reversal
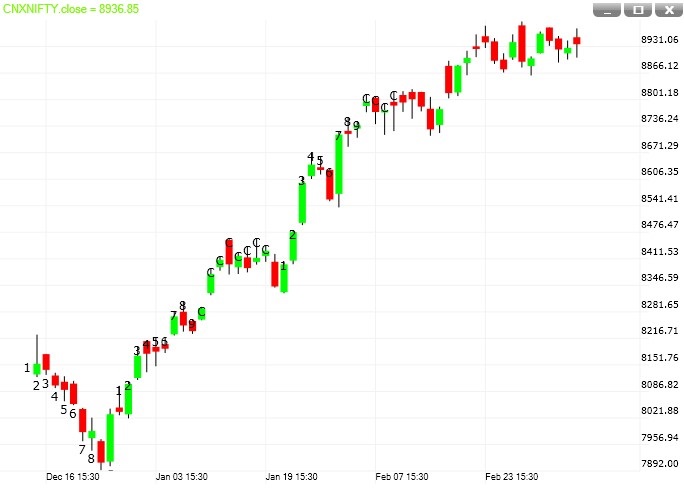
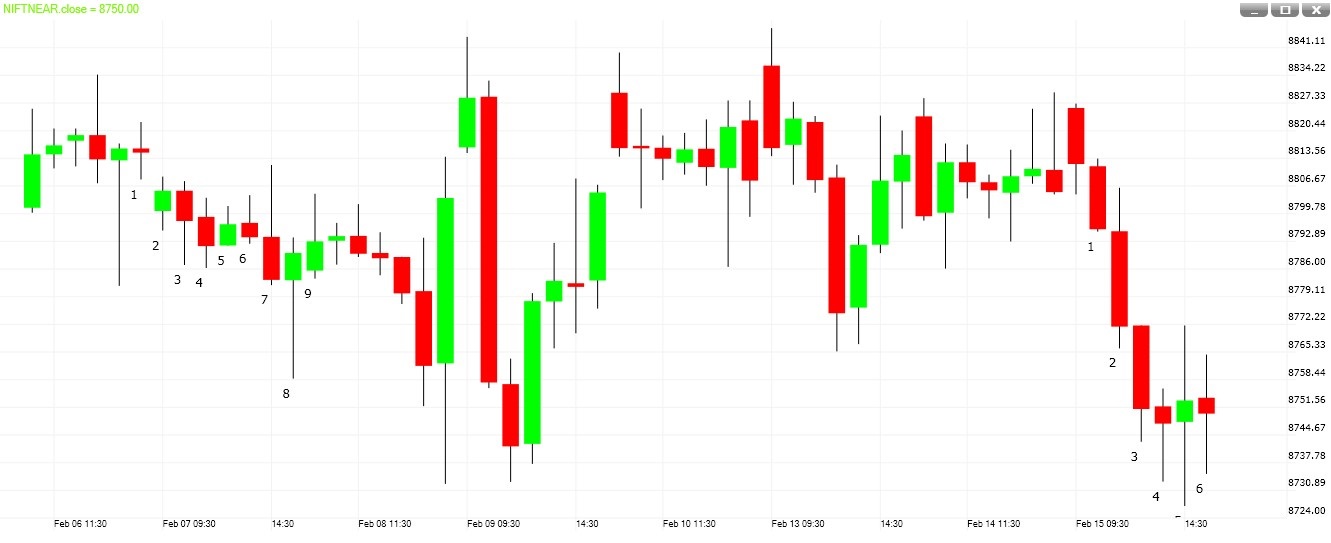
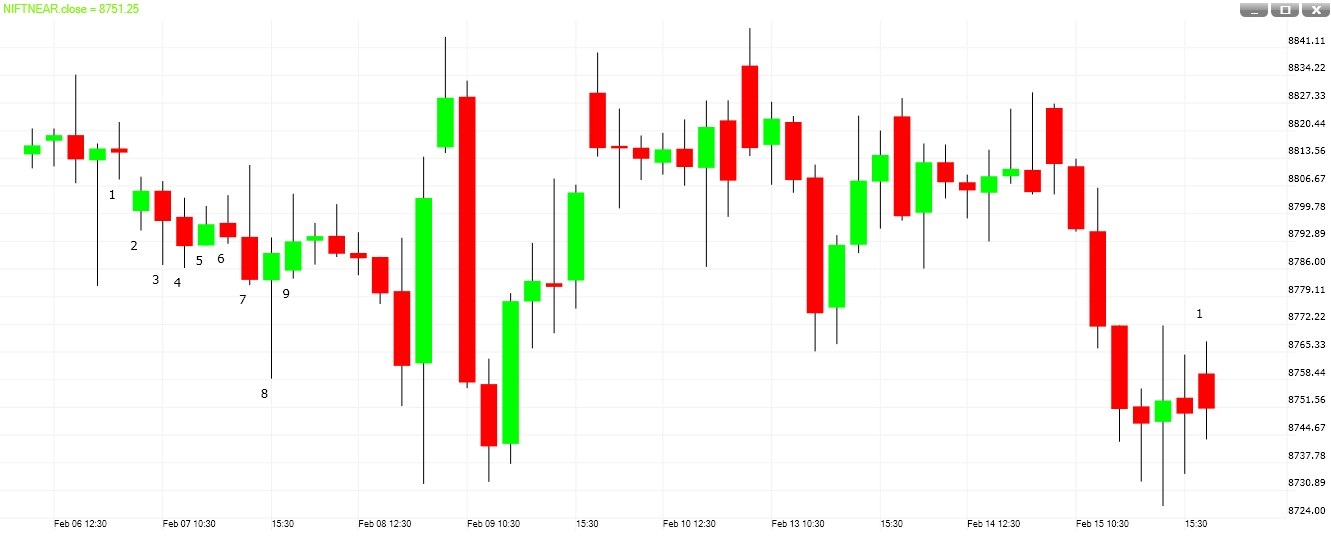
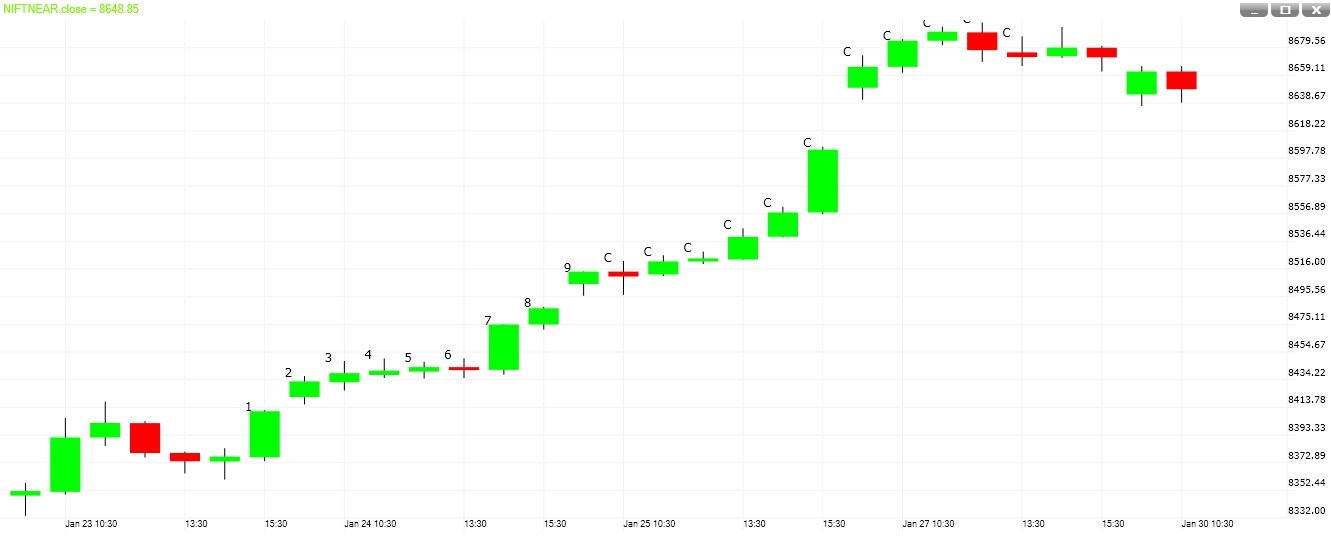
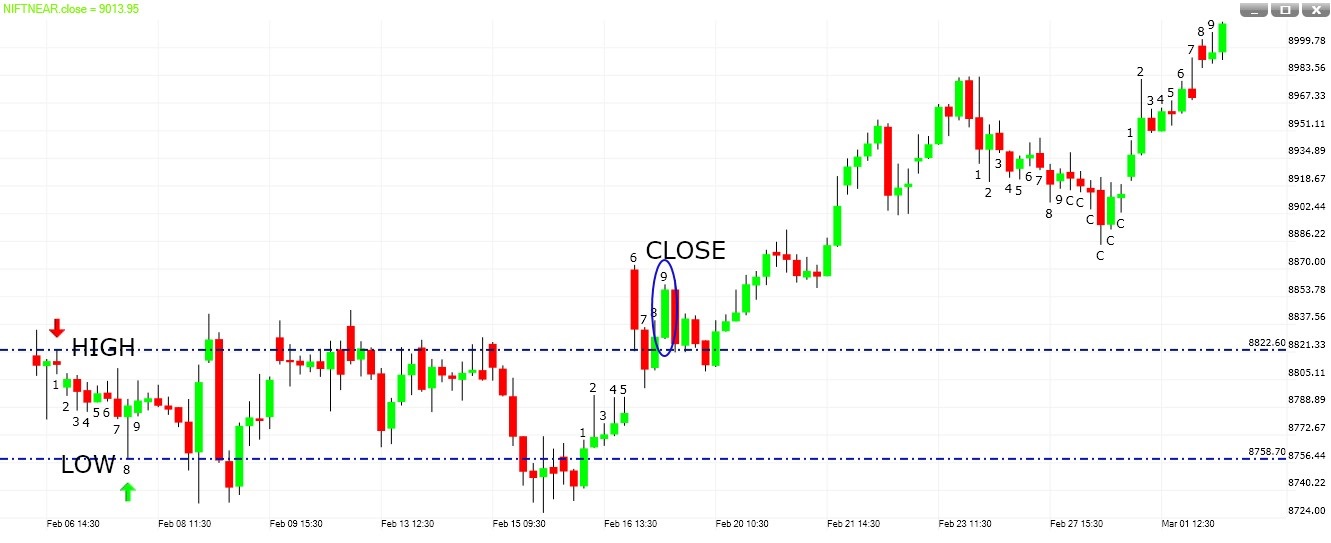
What is C9 set up? The C9 indicator consists of a set of numbers (from 1 to 9) and the letter ‘C’. The numbers and the letter ‘C’ are displayed on price charts at specific locations. When a series of C9 numbers from 1 to 9 appear below prices, selling may be getting exhausted. When a series of C9 numbers from 1 to 9 appear above prices, buying may be getting tired.
C9 Reversals: Incomplete
Warning: C9 reversals which are under way or incomplete can be cancelled and disappear; this option should be used with extreme care. The setup starts with number 1. As long as the conditions meet with the price action, the setup continues to the next number. If price action differs from the conditions, the setup abruptly vanishes.
C9 Reversals: Set Up Completion
C9 reversals are assumed to be completed when 1 to 9 numbers appear on the chart. After 9, ‘C’ can continue but the pattern will remain visible and considered complete.
C9 tells traders:
- There may be an exhaustion of the current trend.
- Look to take profits.
- Consider taking a new trade in the opposite direction.
- Warns if the exhaustion is only a pullback / consolidation.
Finding Top
- Market is rising.
- Numbers 1 to 9 appear above price.
- One or more C can appear.
- When no further numbers and C appear, the setup is complete.
- Numbers may vanish before reaching 9 — the setup was interrupted.
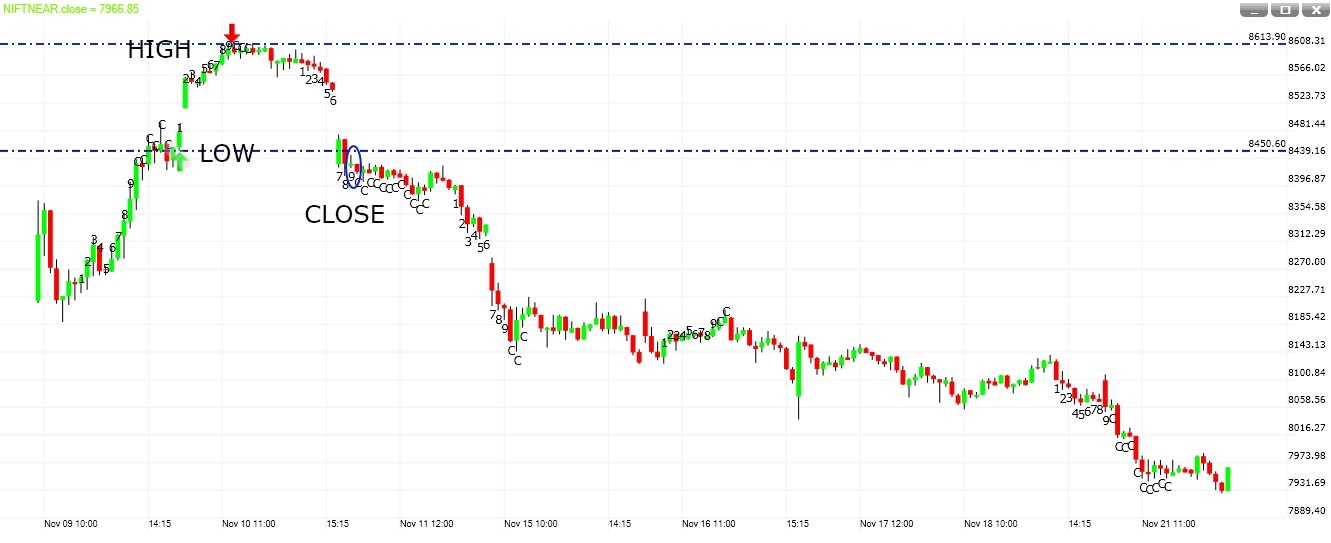
Finding Bottom
- Market is falling.
- Numbers 1 to 9 appear below price.
- One or more C can appear.
- When no further numbers and C appear, the setup is complete.
- Numbers may vanish before reaching 9 — the setup was interrupted.
Features
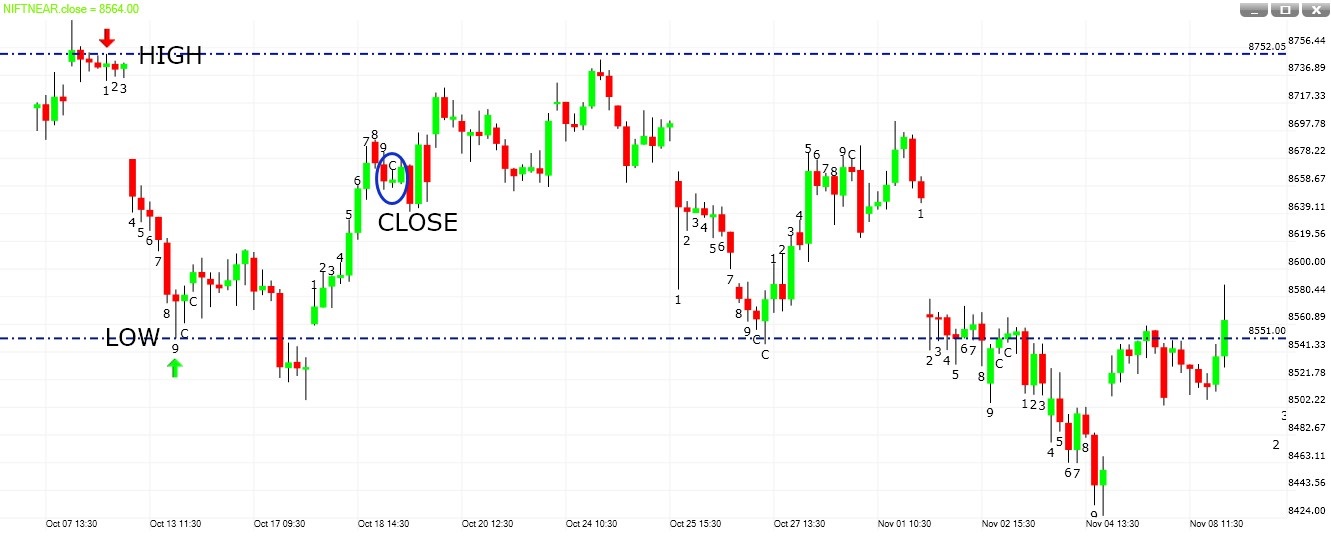
C9 can differentiate between trending and non-trending price action.
- If close of the current C9 9th bar is between the High–Low of the previous completed C9 setup in the opposite direction, the market is in a trading range.
- If close of the 9th bar is above the High of the previous completed opposite C9 setup, the market is in an uptrend.
- If close of the 9th bar is below the Low of the previous completed opposite C9 setup, the market is in a downtrend.
Summary
When a complete C9 setup is visible then (a) close positions, or (b) tighten stops. The C9 signal becomes more powerful when there is additional technical evidence. When C9 gives a reversal signal, selling options becomes a viable strategy. After a confirmed C9, prices should reverse or consolidate — in both cases, option premiums will fall.
Chaos Alligator
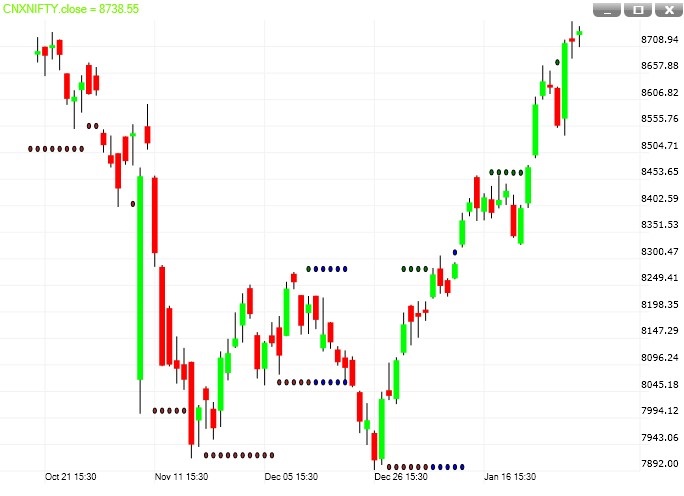
A trading strategy based on the Alligator and Fractals concept. The Chaos indicate signal by 3 Dots (Green, Brown & Blue).
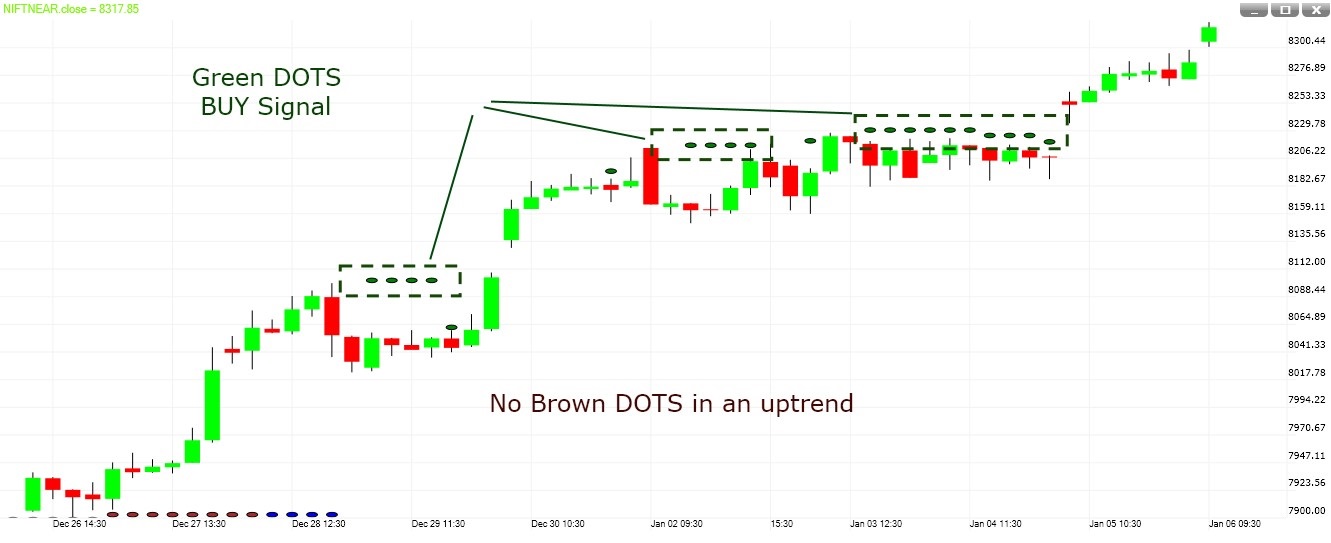
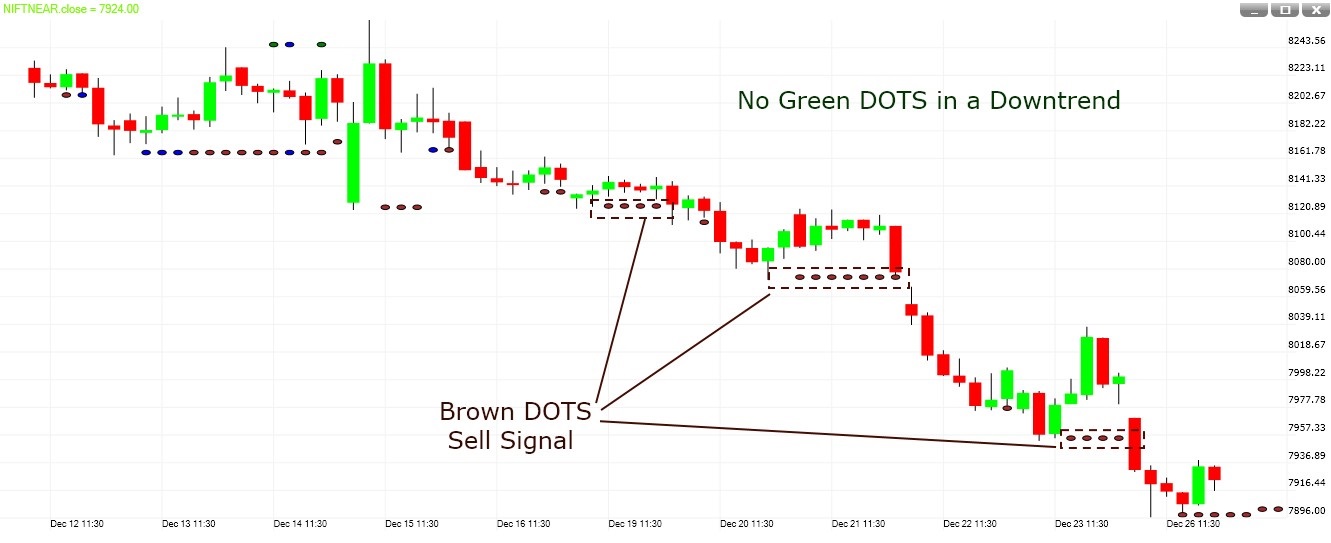
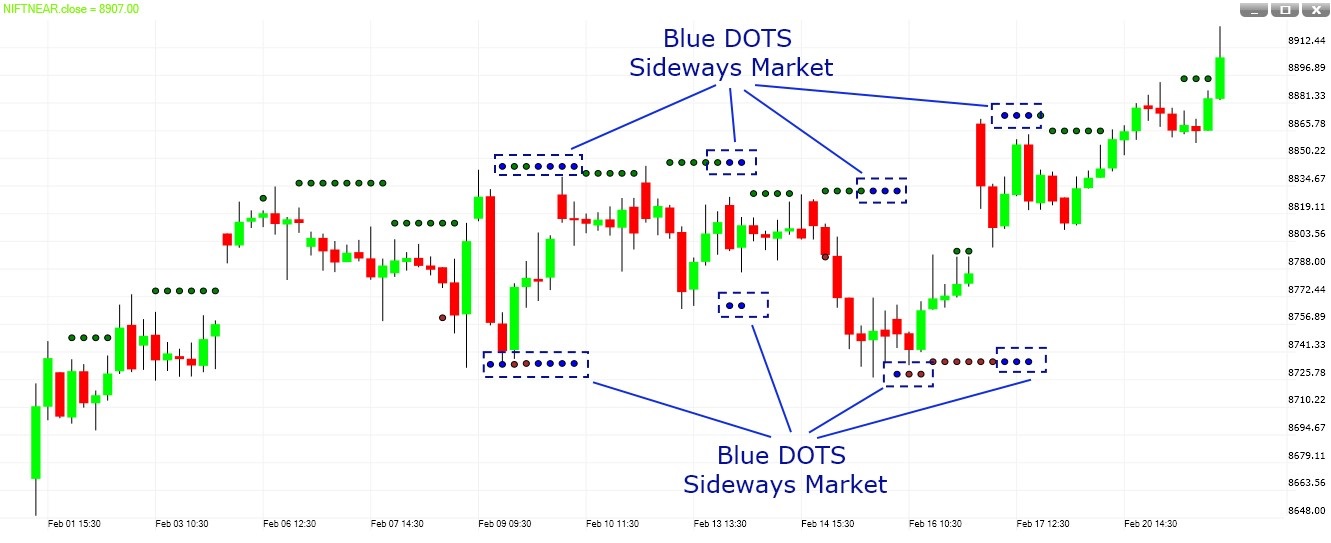
- Green Dots signify buy signals. No sell signals in an uptrend.
- Brown Dots signify sell signals. No buy signals in a downtrend.
- Blue Dots signify a non-trending / sideways market.
- Dots above price highs are buy levels.
- Dots below price lows are sell levels.
- When the market is sideways we can take both buy & sell signals.
Escala Day Trader
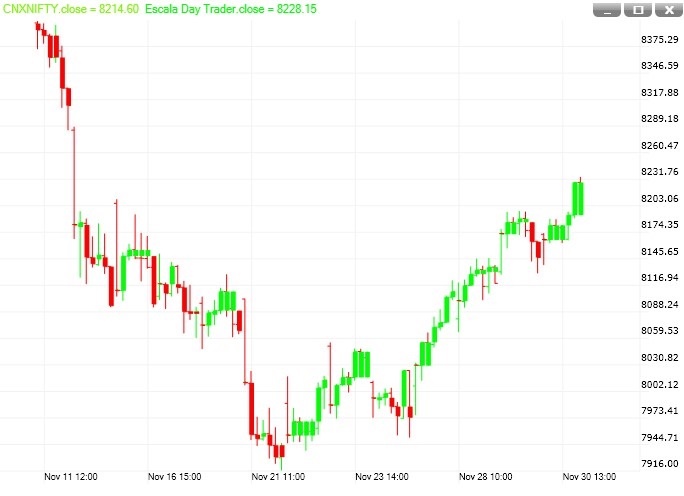
Escala Strategy depicts the market direction. It is a trend follower and, because all the well-known rules of support/resistance, trend-lines, time frames, double or triple tops/bottoms, ascending/descending triangles and retracements apply, the trader will quickly grasp the messages the market conveys. Escala is a charting style, an indicator and a trading system in itself.
The basic concept is to buy on the completion of a green line and to sell on the completion of a red one. Buying or selling after the market turned is the preferred choice of trend followers. The exit signal comes when there is a signal in the reverse direction, when a profit target is reached, or when the market fails to move according to expectations.
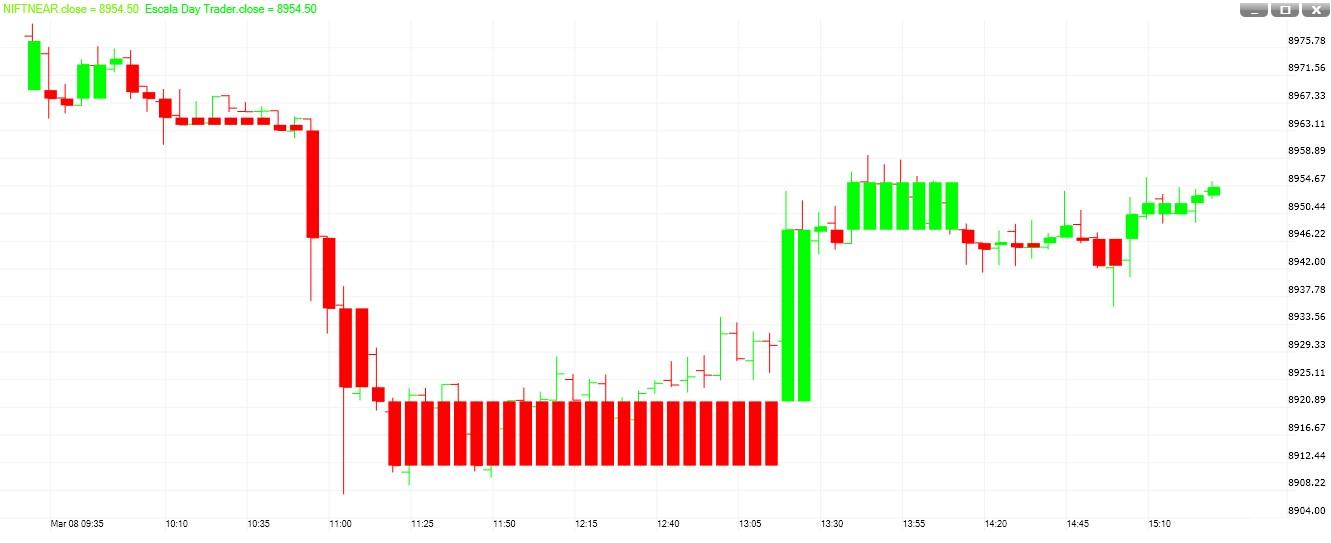
For intraday chart: Escala calculates trend from today’s open. On a 5-minute chart, if green lines outnumber red ones by 10:00 a.m., the day has a bullish bias. If red lines outnumber green by 10:00 a.m., the day has a bearish sentiment.
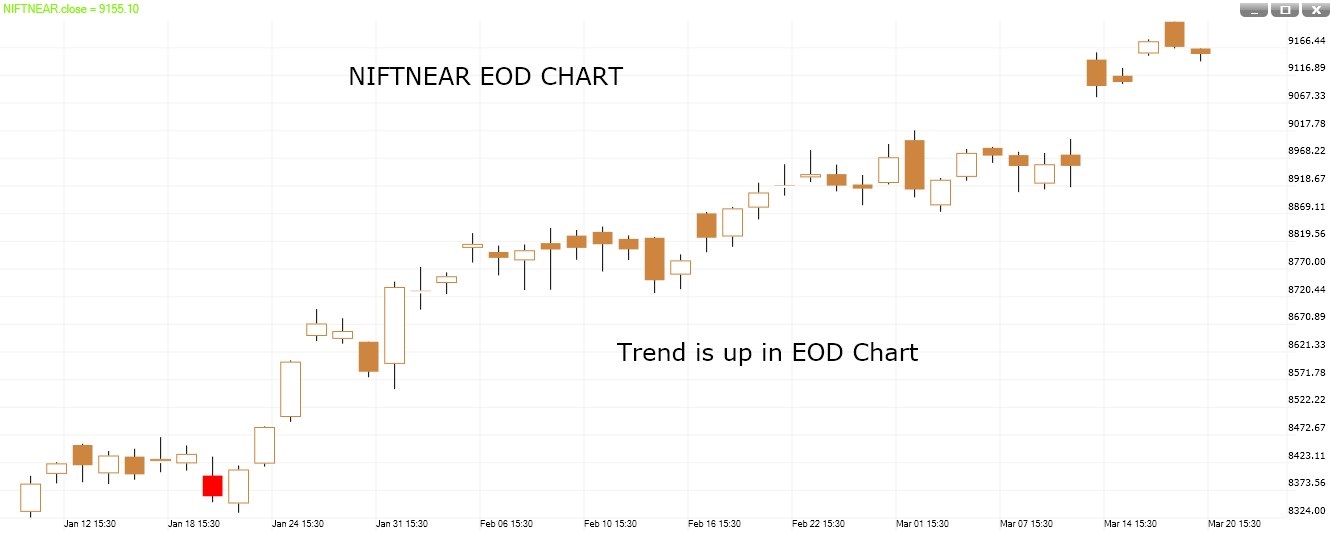
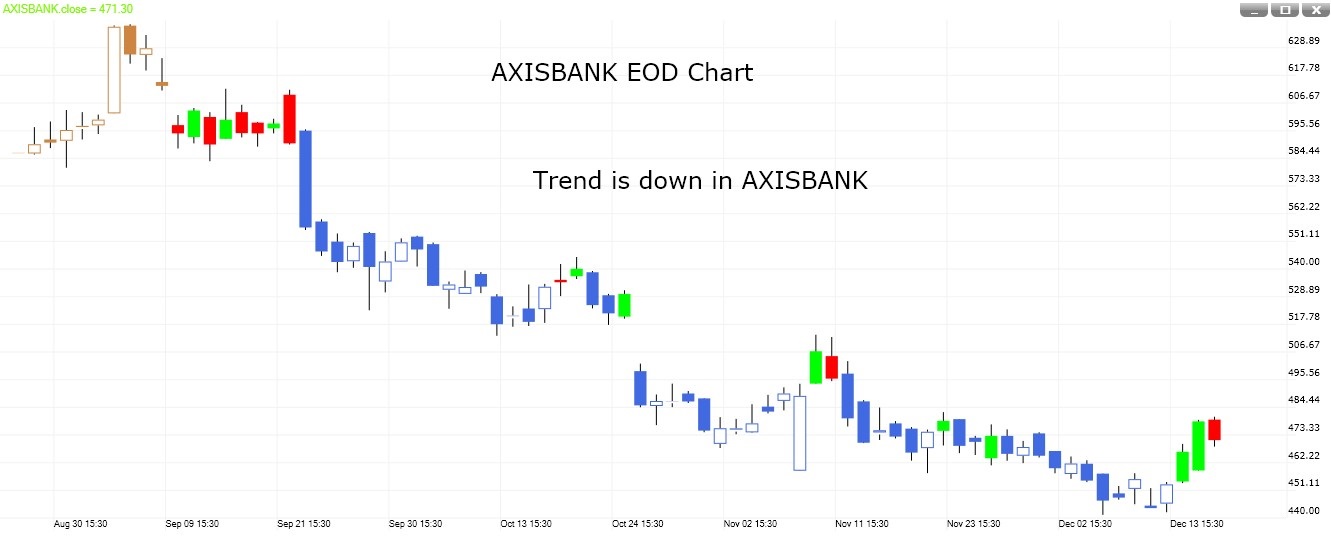
For EOD chart: Buy when the first green bar appears and exit if red bars start coming. Sell when the first red bar appears and exit if green bars start coming. Always use previous bar high and low for placing entry orders.
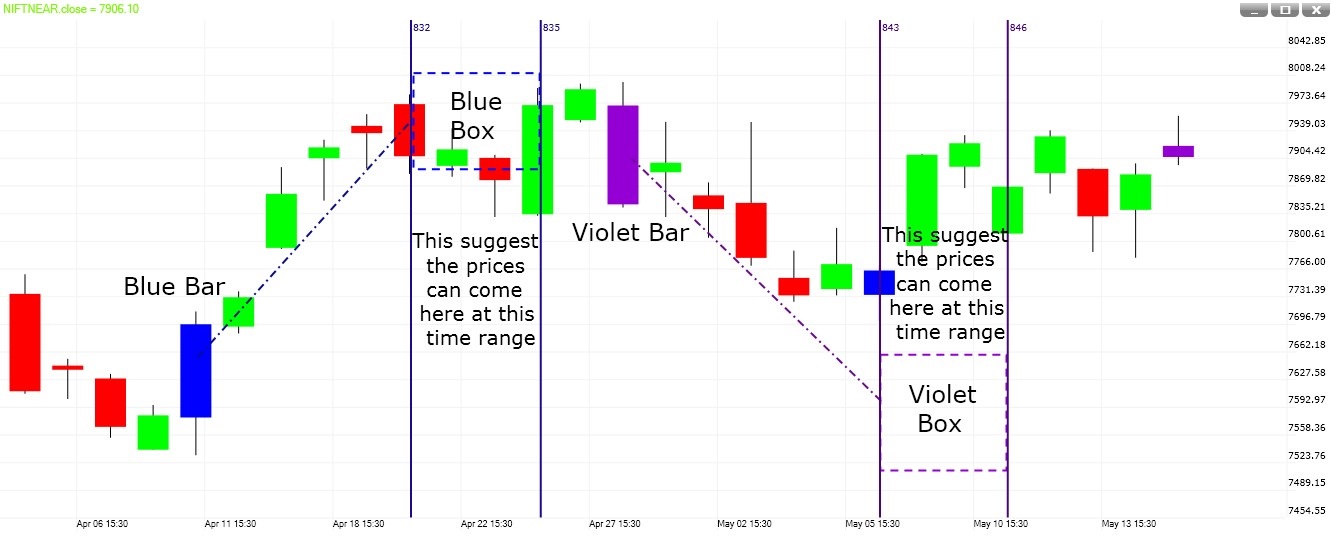
TA Forecast
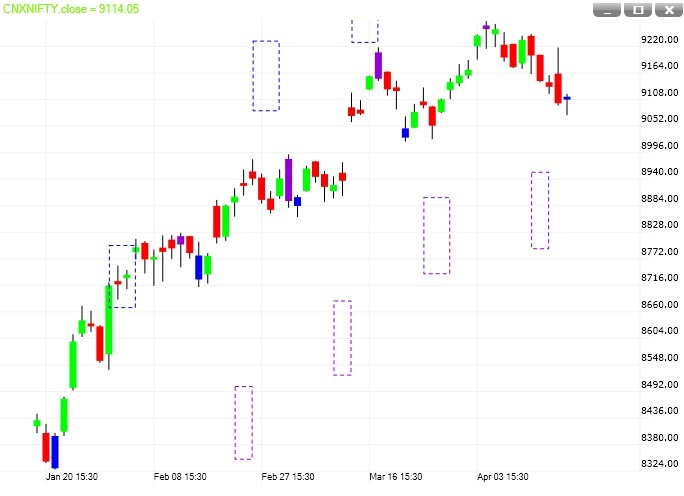
It shows (a) where a stock price can go (target) and (b) when the target can be reached (time period).
TA Forecast has two parts: (a) colored bar and (b) dotted rectangle. Bars are colored after two or three ticks. Boxes should be used for target.
- Upside – Blue: Blue bar appears when TA Forecast predicts an up move. A blue dotted rectangle appears above the price level.
- Downside – Violet: Violet bar appears when TA Forecast predicts a down move. A violet dotted rectangle appears below the price level.
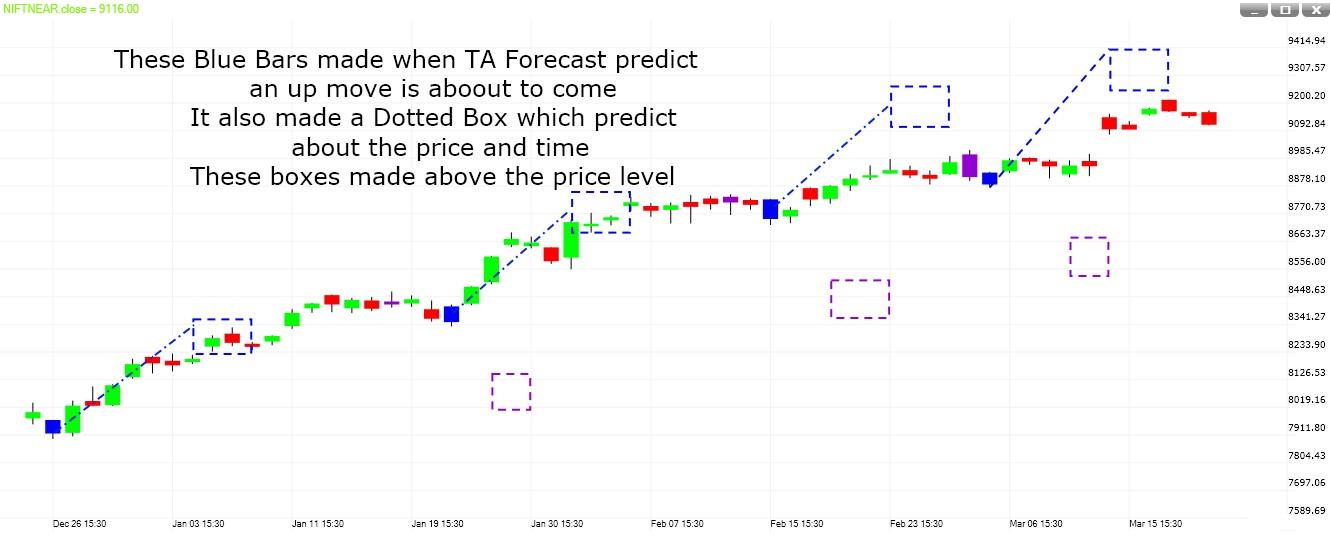
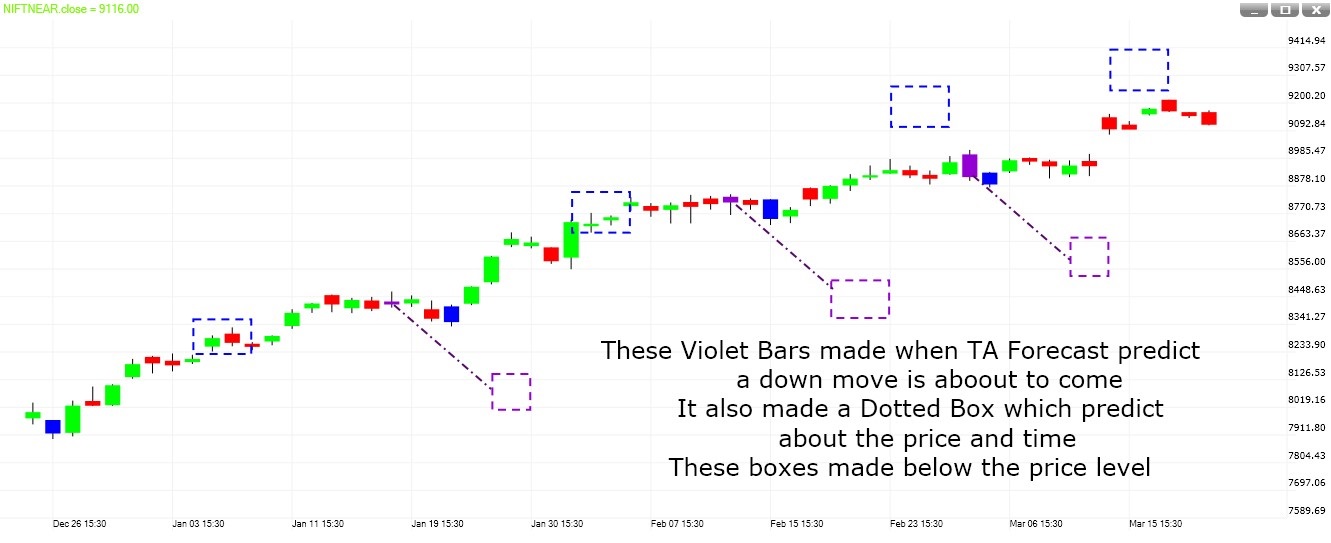
Price: Expected swing high and low. Vertical lines of the rectangle represent the price range.
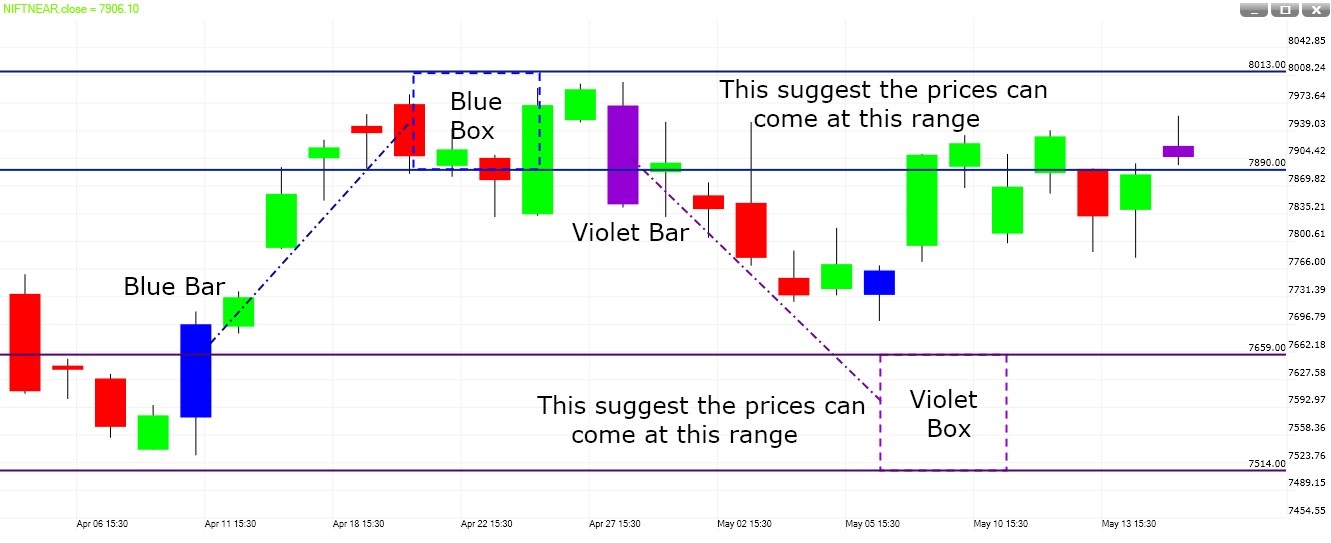
Time: Time zone in which high and low will be made. Horizontal lines represent when price can make a high or low.
TA Turtle
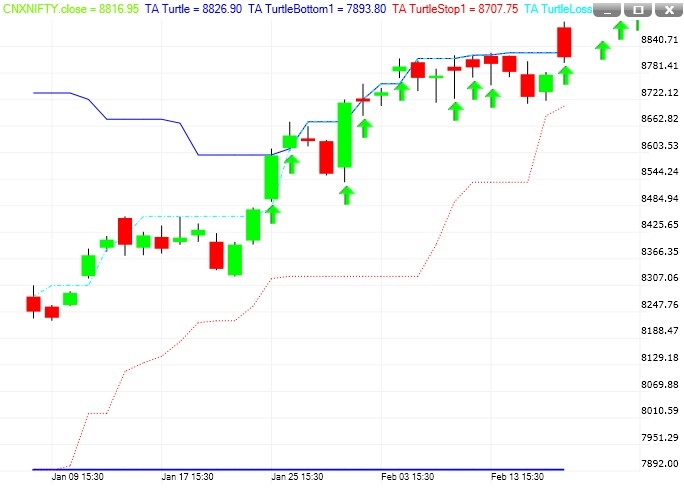
TA Turtle is a complete trading system covering every aspect of trading:
- What to buy or sell?
- How much to buy or sell?
- When to buy or sell?
- When to get out of a losing position?
- When to get out of a winning position?
TA Turtle Setup
- Period – 55
- 1 Loss Entry – 20
- Stop Line – 10
55 bar breakout line (deep blue): Top line connects highest 55 bar highs; bottom connects lowest 55 bar lows. Buy when prices cross the top line; sell when prices cross the bottom line.
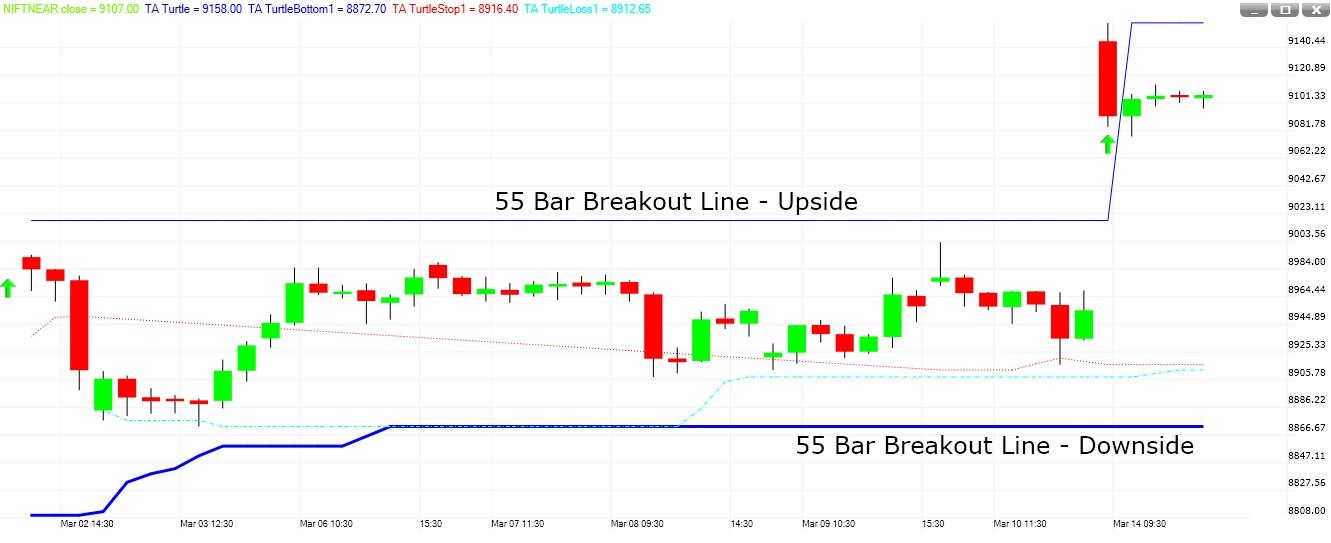
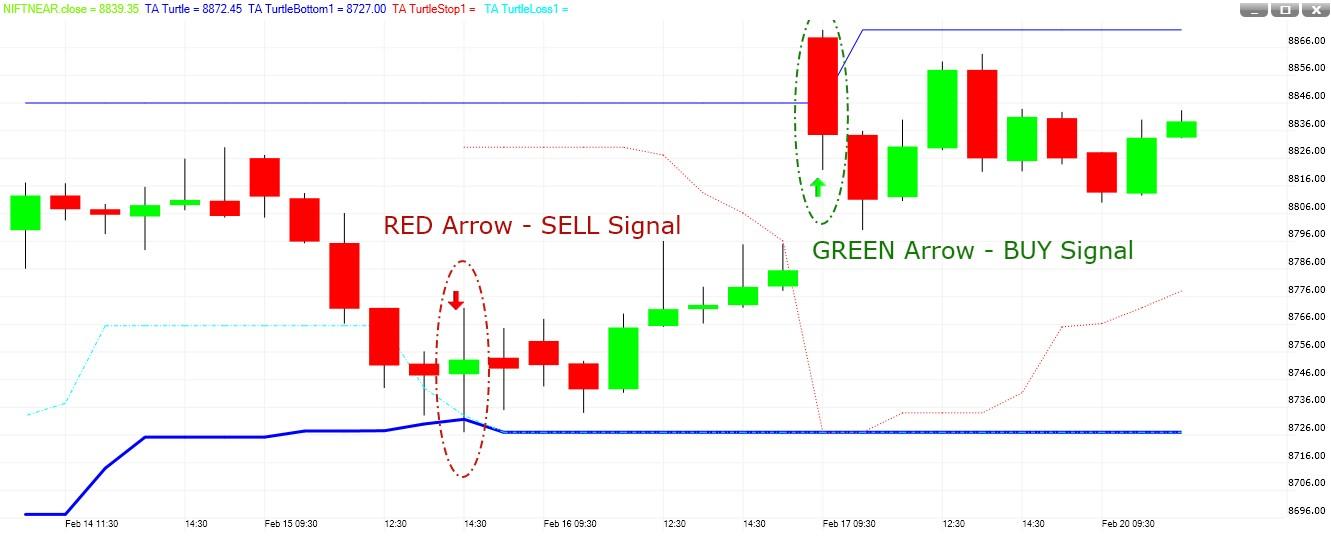
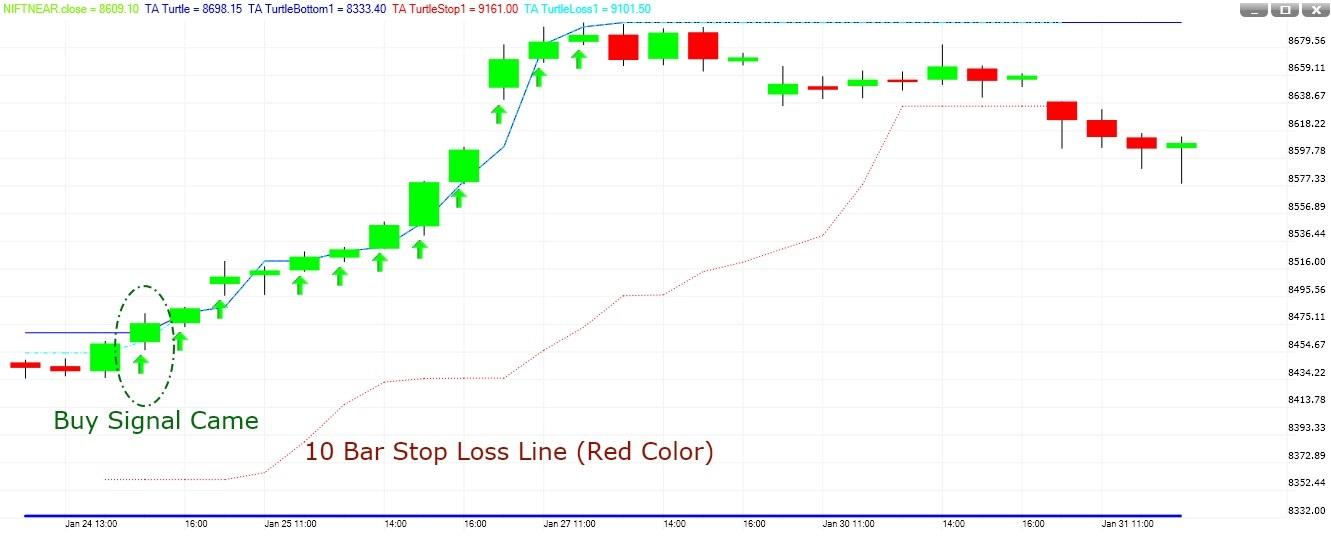
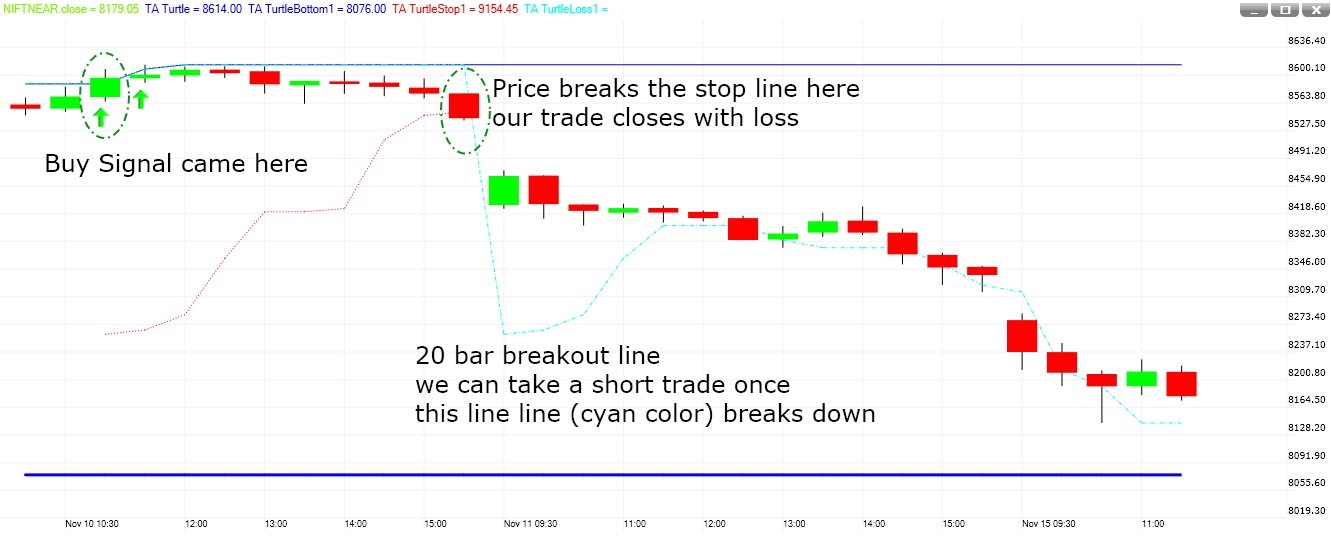
Entry Rules
- Always enter on a 55 bar breakout.
- Enter on a 20-bar breakout if the previous trade was a losing trade in the opposite direction (cyan line).
- Once there is profit in one direction, continue trading that direction with 55 and 20 bar breakouts; opposite-direction 20-bar trades require a prior loss (rule 2).
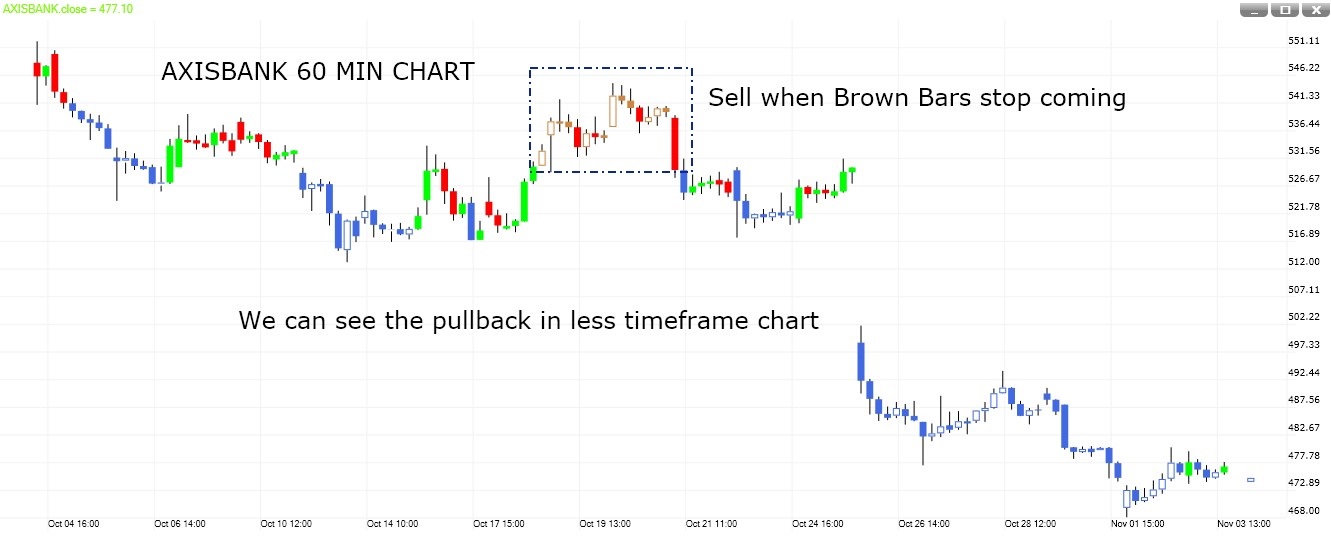
Trend Energy
Trend Energy shows the current trend and identifies pullbacks. It can be used for buying and selling opportunities on dips as well as breakouts.
In an uptrend: Brown bars represent trend; blue bars represent pullback.
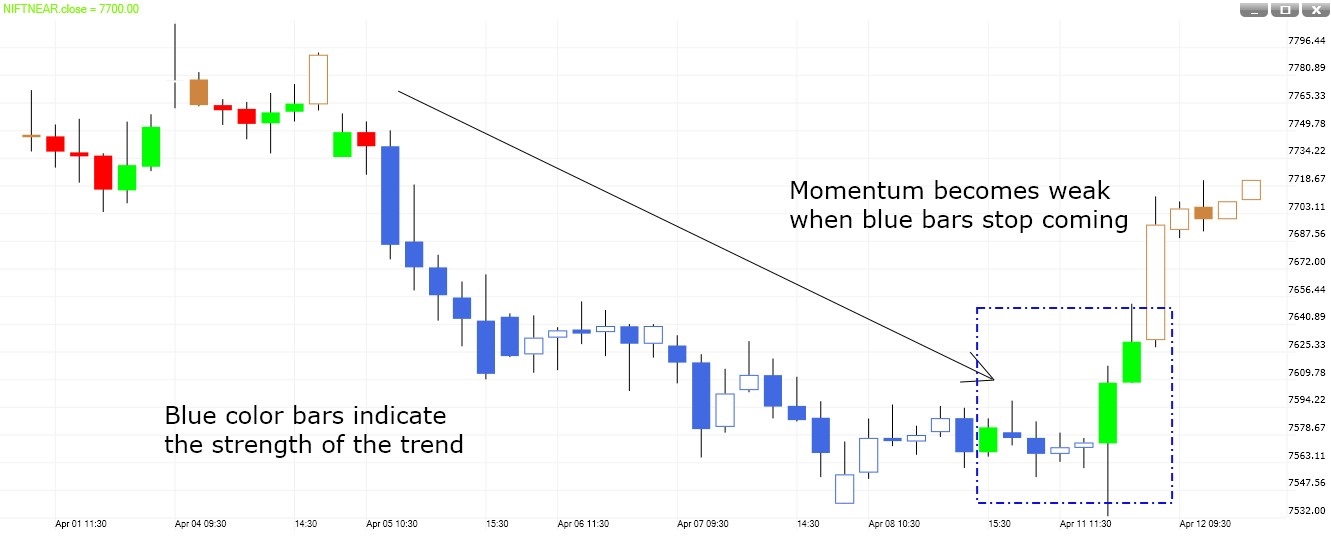
In a downtrend: Blue bars represent trend; brown bars represent pullback.
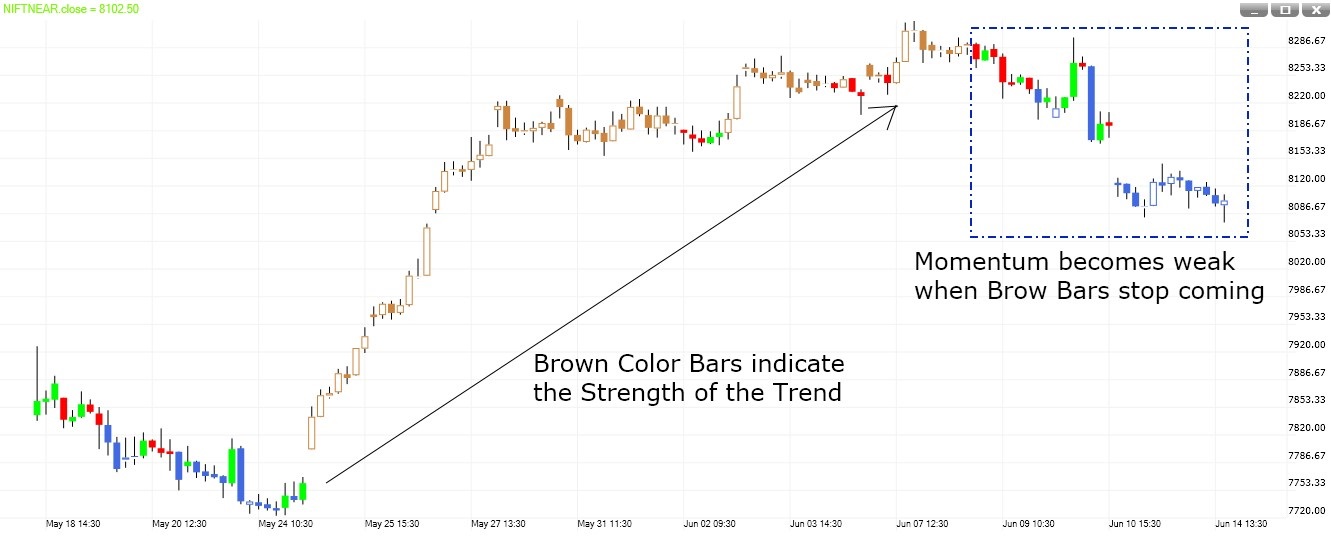
Momentum Buying
Type 1 – Buy in strength: Buy only in an uptrend when the first brown bar appears. Take profit when brown bars stop coming.
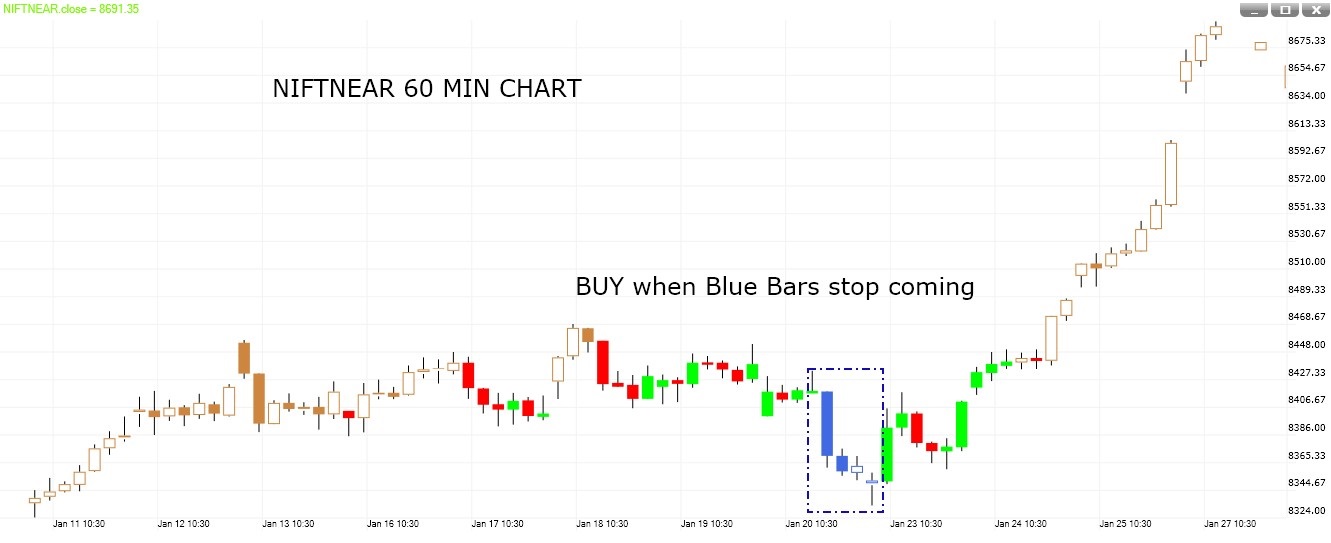
Type 2 – Buy in pullback: In an uptrend, blue bars indicate pullback. Buy when blue bars stop coming.
Momentum Selling
Type 1 – Sell in weakness: Sell only in a downtrend when the first blue bar appears. Take profit when blue bars stop coming.
Type 2 – Sell in pullback: In a downtrend, brown bars indicate pullback. Sell when brown bars stop coming.
Summary
In an uptrend, buying is possible with brown bars (breakouts) and blue bars (dips). In a downtrend, selling is possible with blue bars (breakdowns) and brown bars (rallies). Always try to buy above previous high and sell below previous low to avoid whipsaws.
Indicator
Bar Patterns
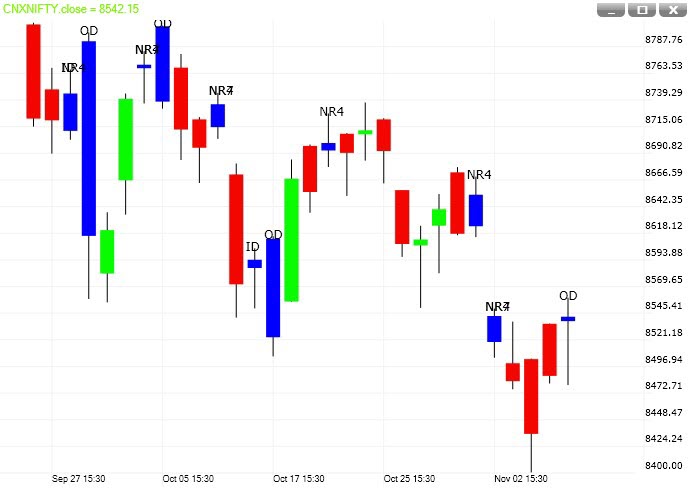
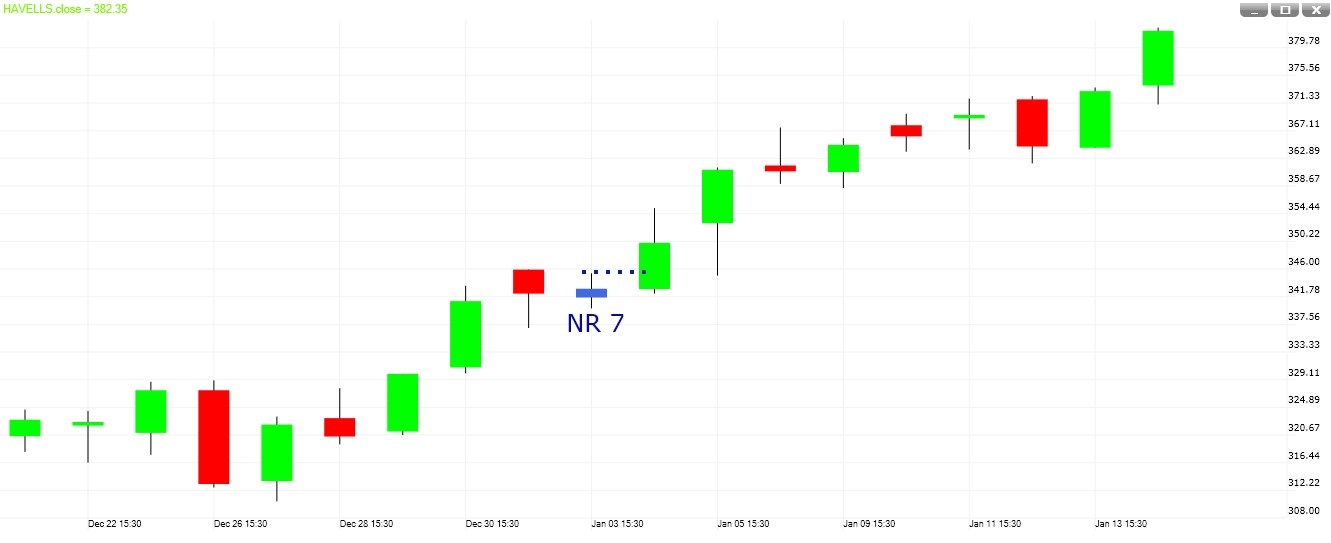
NR 7
Requires seven bars. If the last bar has the smallest range in the sequence, it is an NR7 pattern. Indicates decreasing volatility and alerts you to standby for explosive moves. Trade: buy breakout of the high; sell breakout of the low.
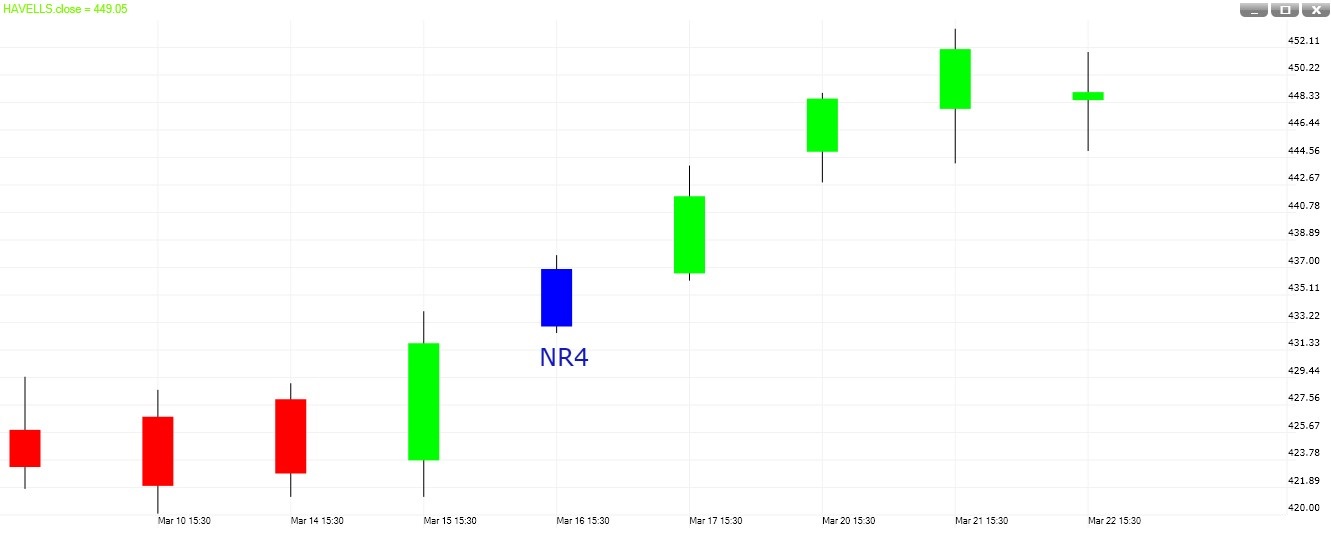
NR 4
Same concept with four bars. Trade breakouts of the last bar high or low.
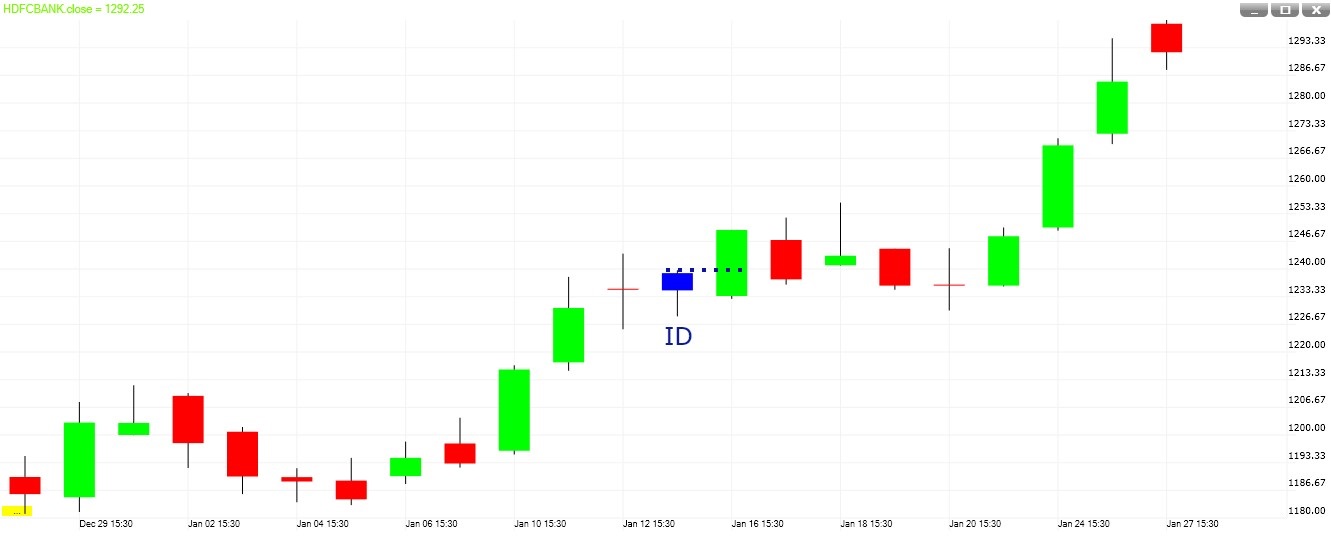
Inside Day
Second bar stays completely within the range of the bar before it — a pause in price action. Place a buy stop above its high and a sell stop below its low; cancel the other when one triggers.
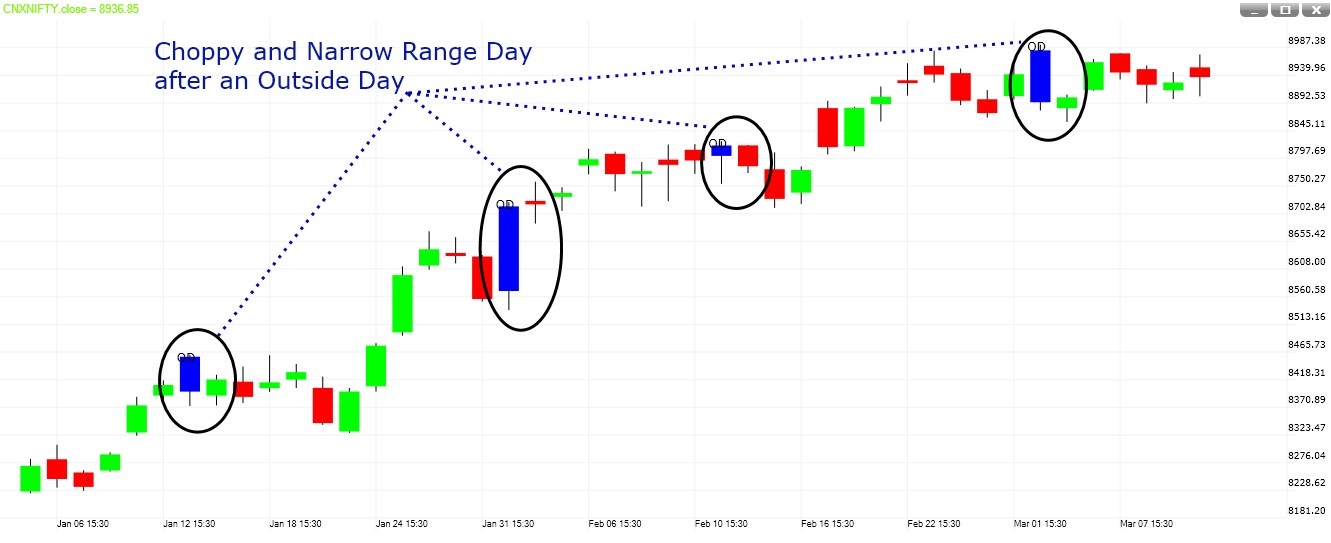
Outside Day
Range exceeds the previous bar with higher high and lower low. Shows short-term expansion in volatility. Often wise to avoid trading the next day.
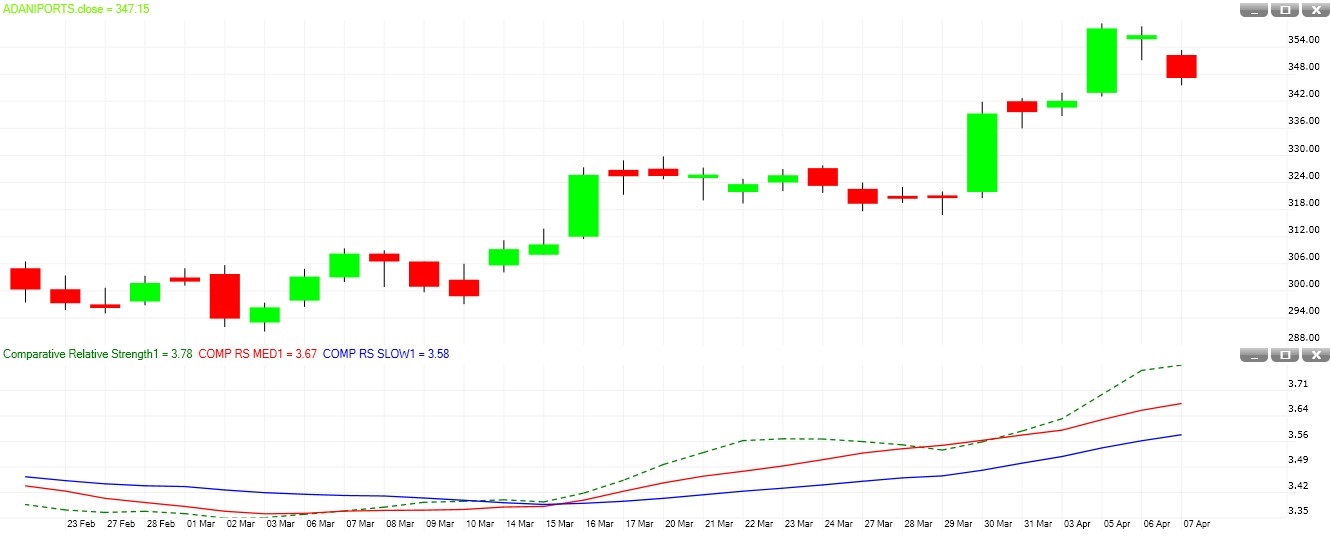
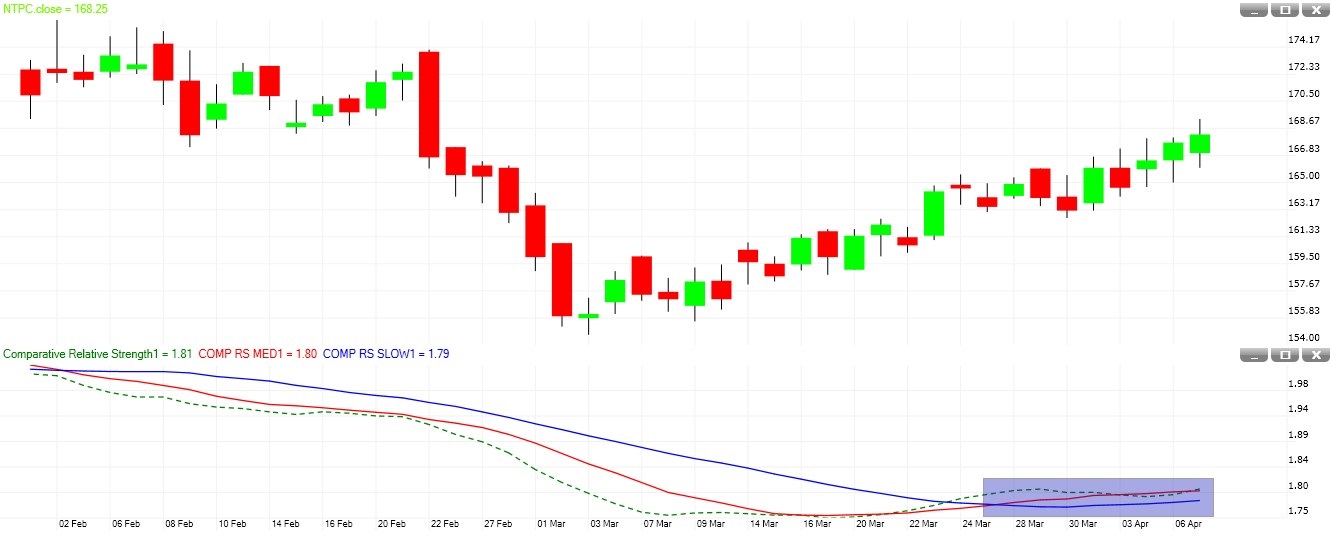
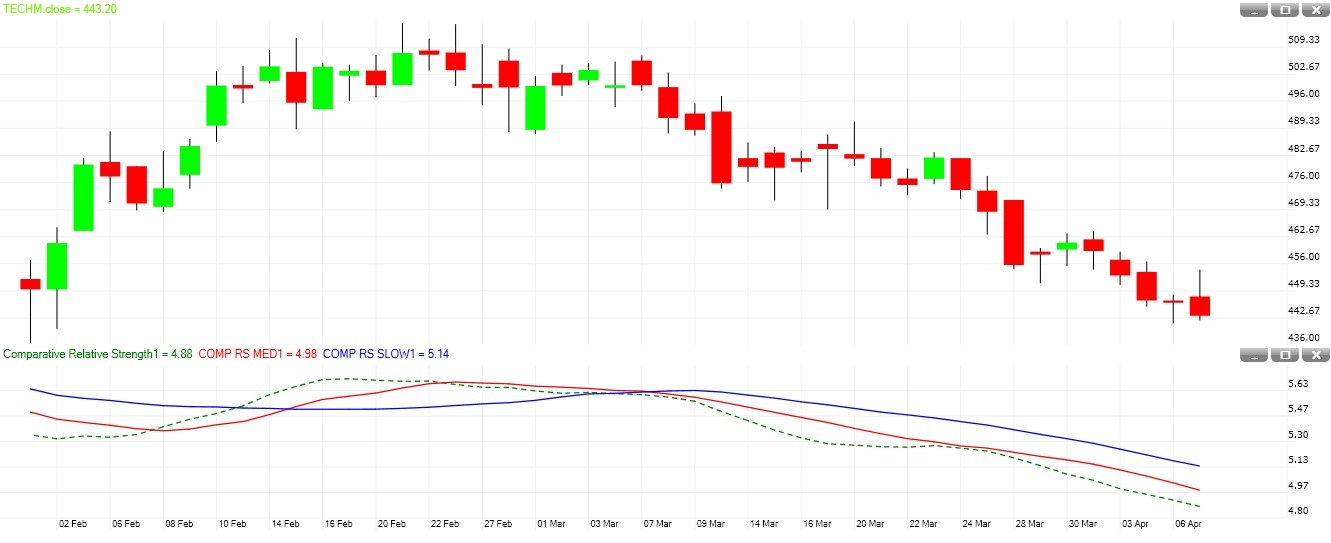
Comparative Relative Strength
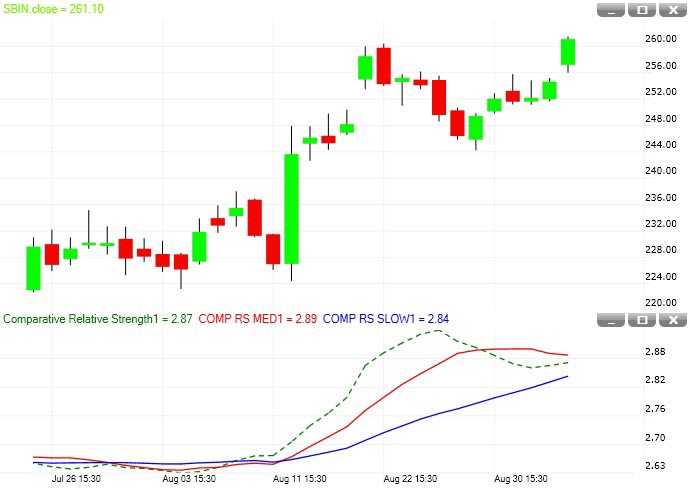
Comparative Relative Strength compares two securities to show relative performance. Do not confuse with the Relative Strength Index.
When the indicator moves up, the security outperforms the base. When sideways, both perform similarly. When moving down, the security underperforms.
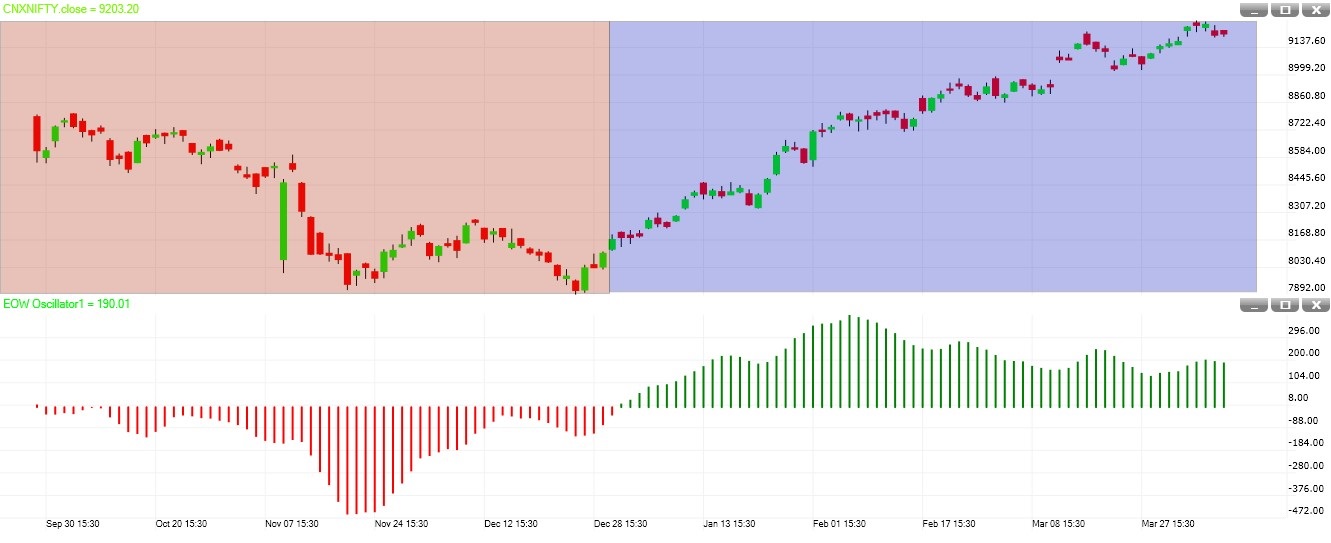
EOW Oscillator
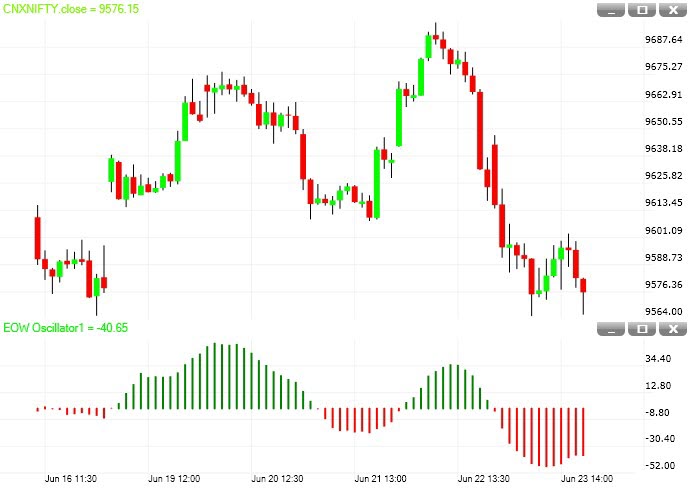
Difference of 5 and 35 days SMA, plotted as a histogram. Green histogram suggests uptrend; red suggests downtrend.
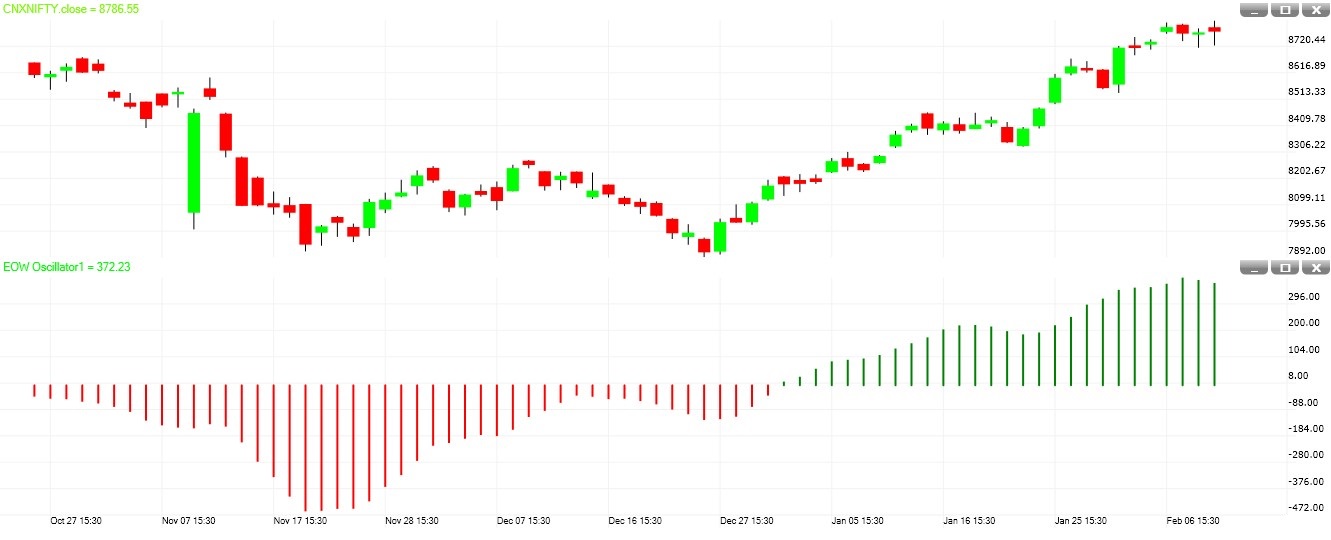
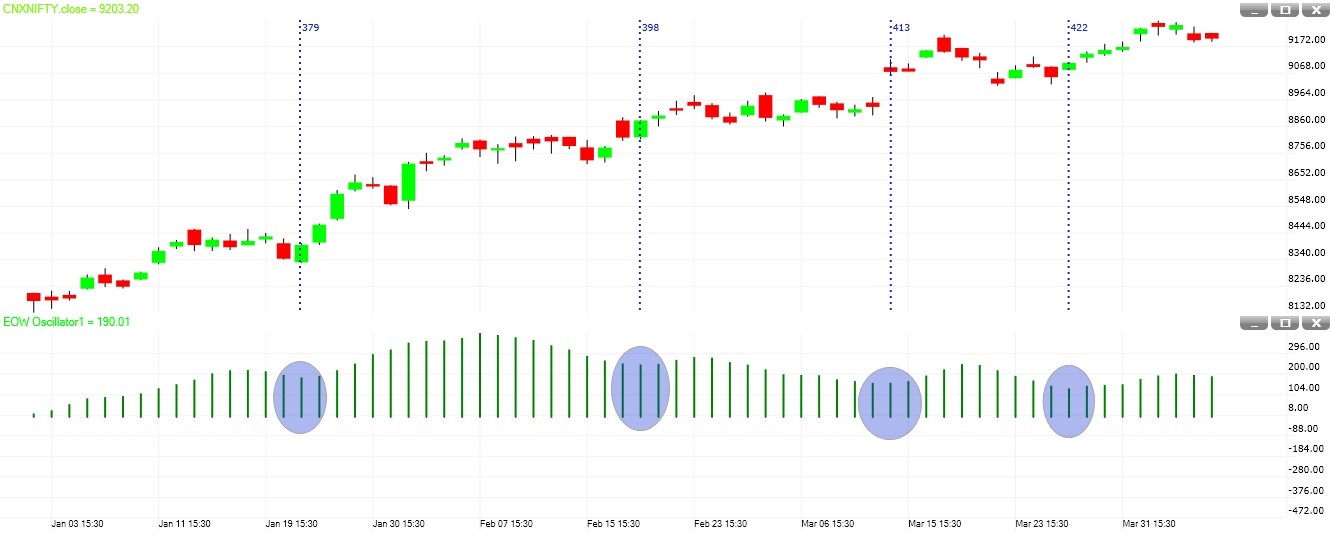
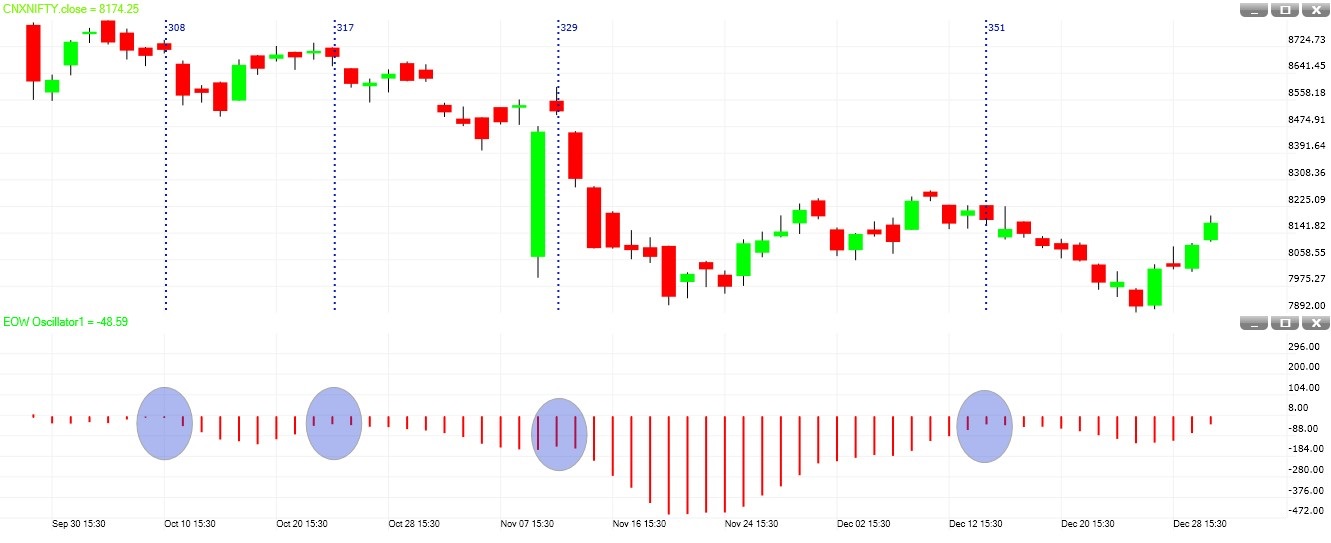
Buy on dip / sell on rally: In an uptrend, buy when green histogram decreases then increases. In a downtrend, sell when red histogram increases then decreases.
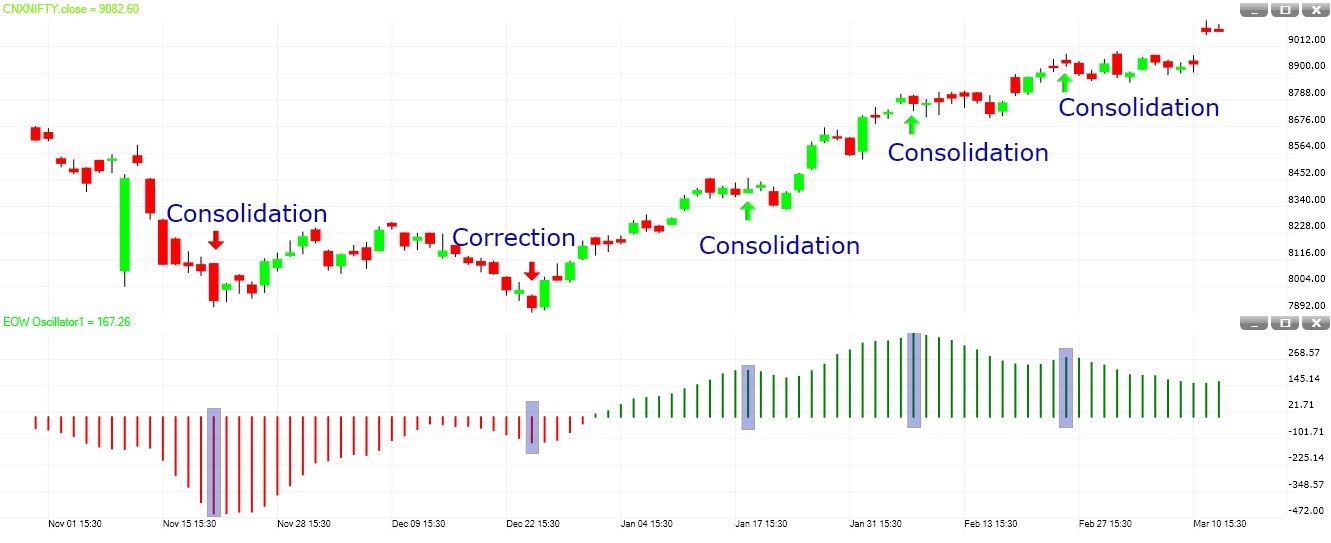
When green or red histogram makes a top or bottom, consolidation or correction is likely.
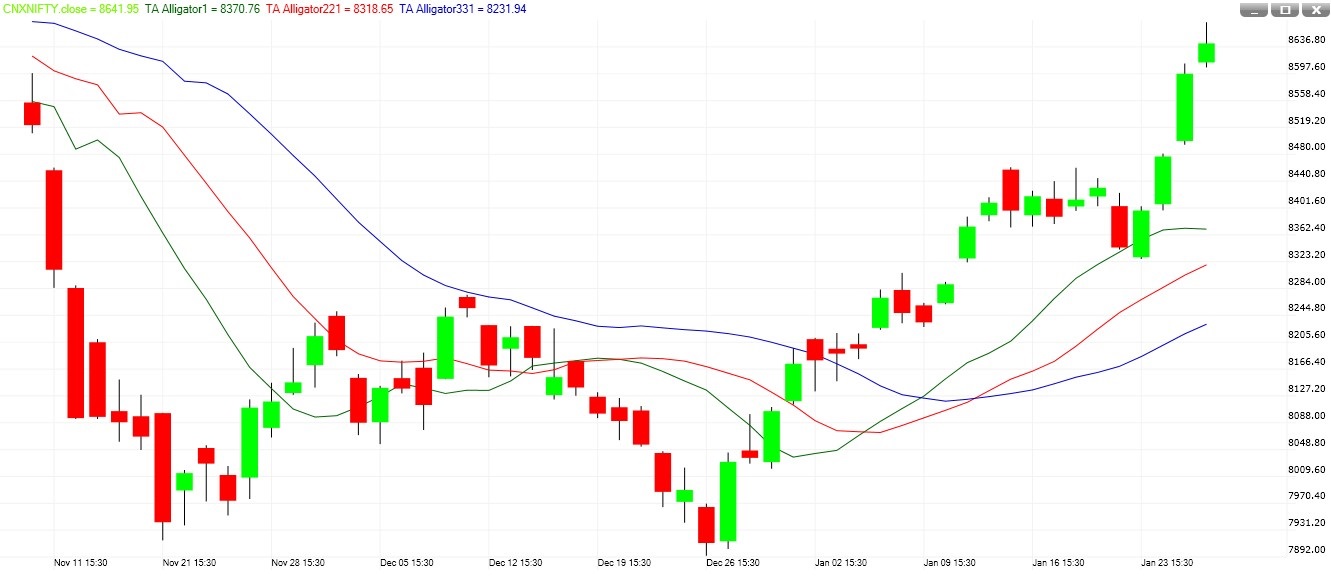
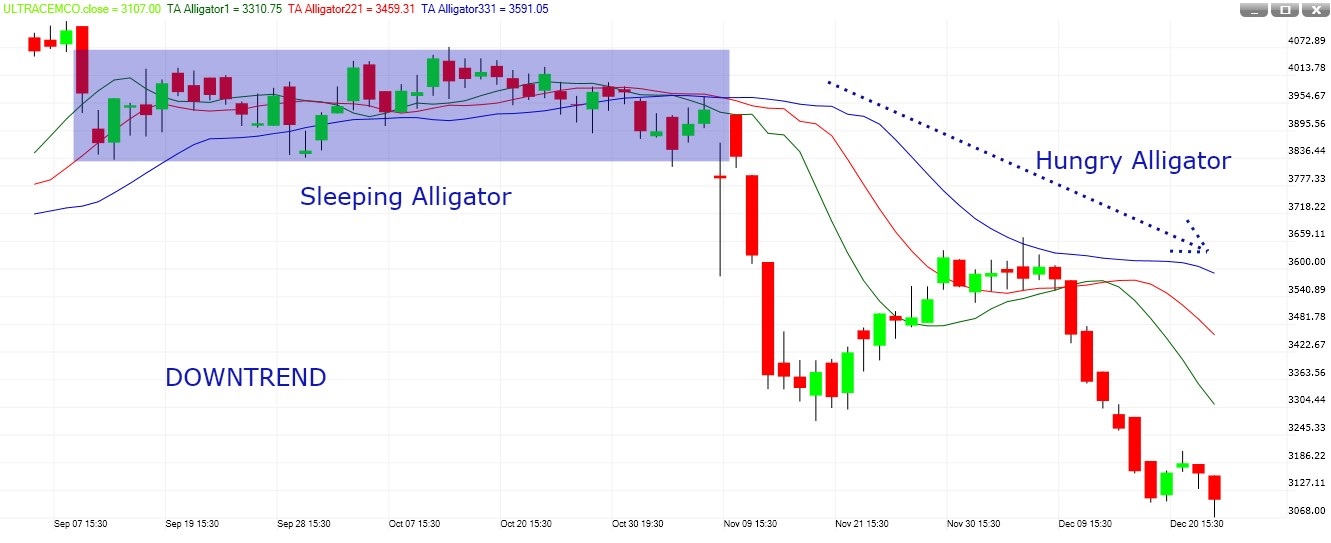
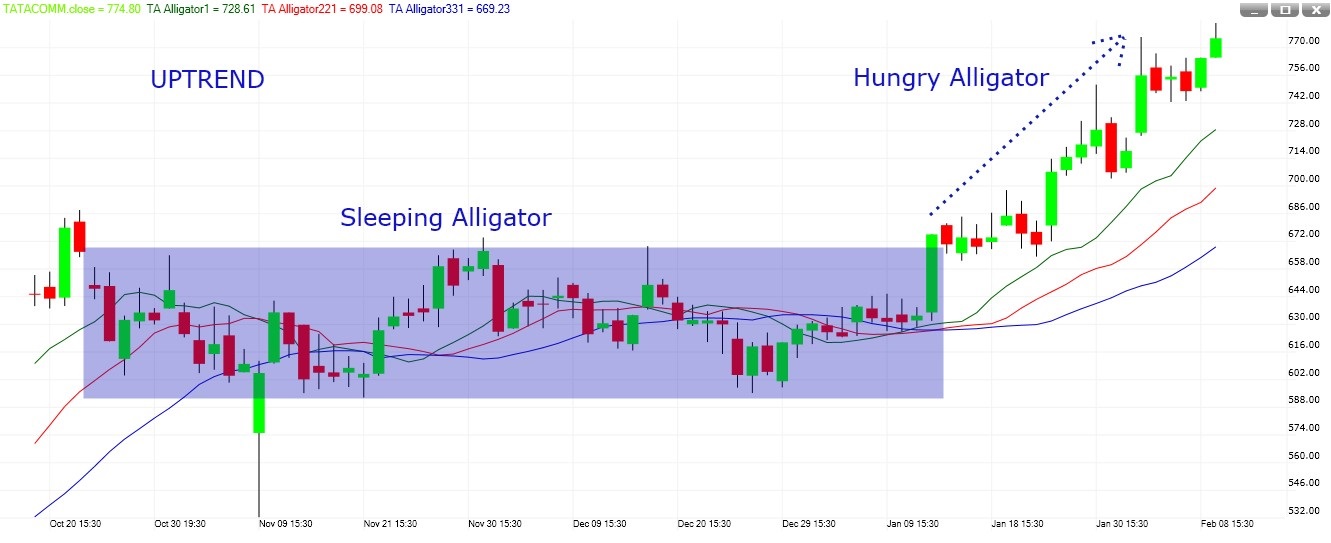
TA Alligator
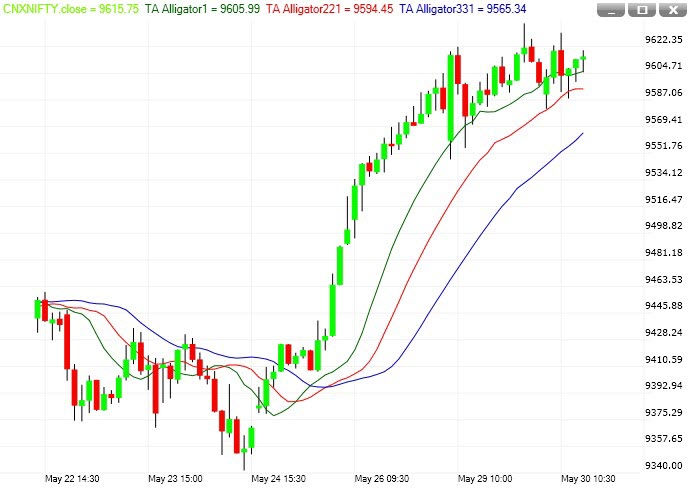
Three smoothed moving averages: blue (jaw), red (teeth), green (lips). Helps spot real trends and avoid range-bound trading.
- Up trend: Green on top, red middle, blue bottom.
- Down trend: Blue on top, red middle, green bottom.
- No trend: Lines are mixed — avoid trading.
- Sleeping Alligator: All three mixed, market sideways.
- Hungry Alligator: Lines separated and moving in one direction.
Buy signal: Green line crosses above the other two.
Sell signal: Green line crosses below the other two.
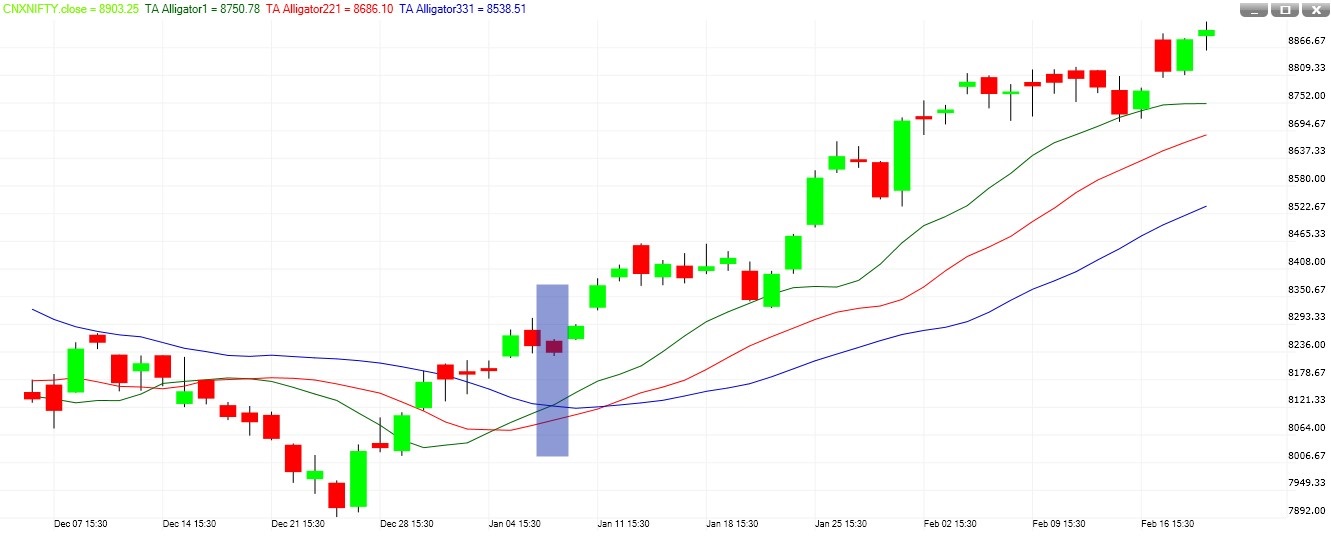
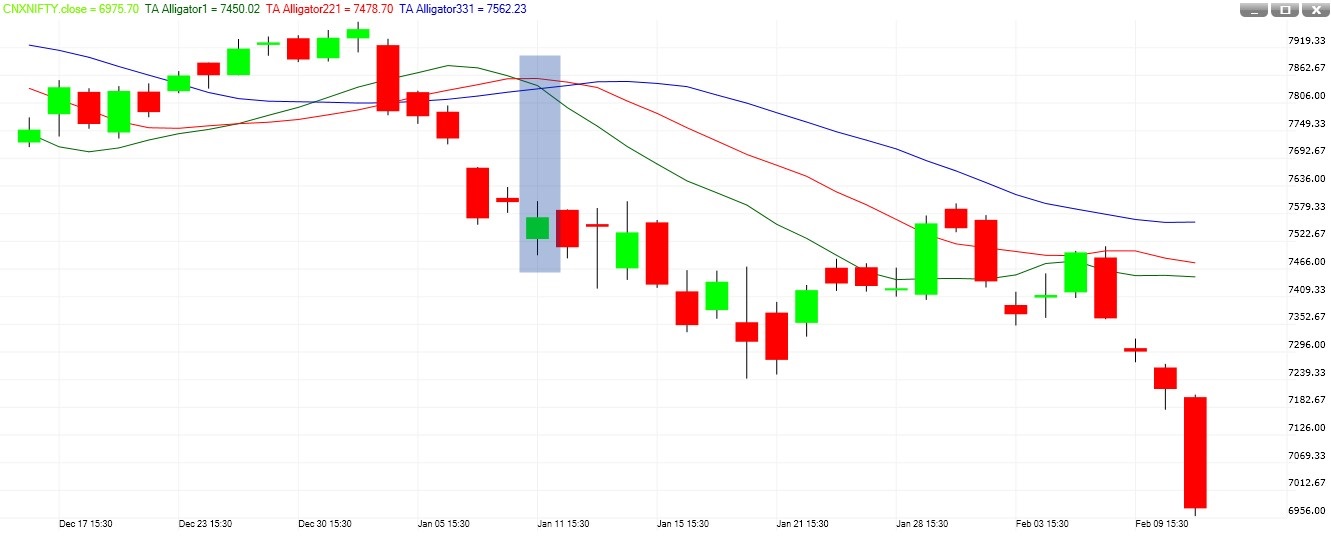
Best trades come when the alligator is sleeping. Use with momentum indicators for confirmation.
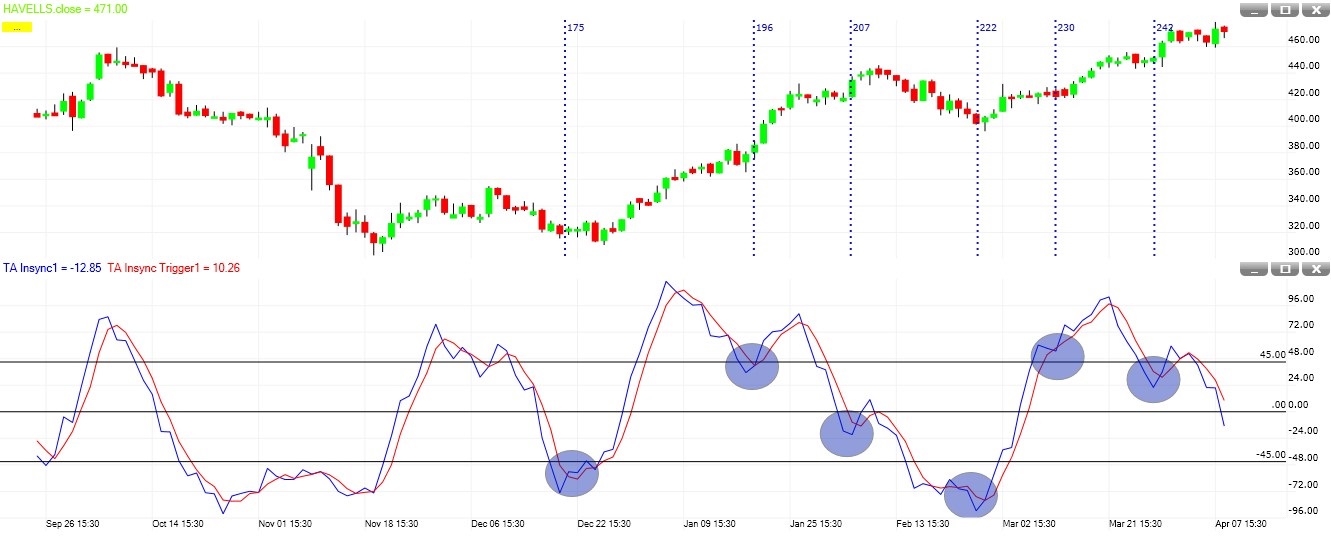
TA Insync
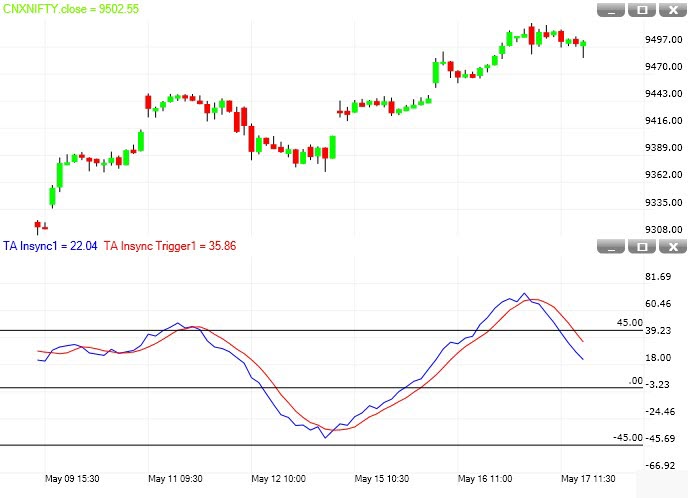
Combines trend and momentum. A consensus oscillator that helps determine extreme price levels. Values above +45 are overbought; below -45 are oversold.
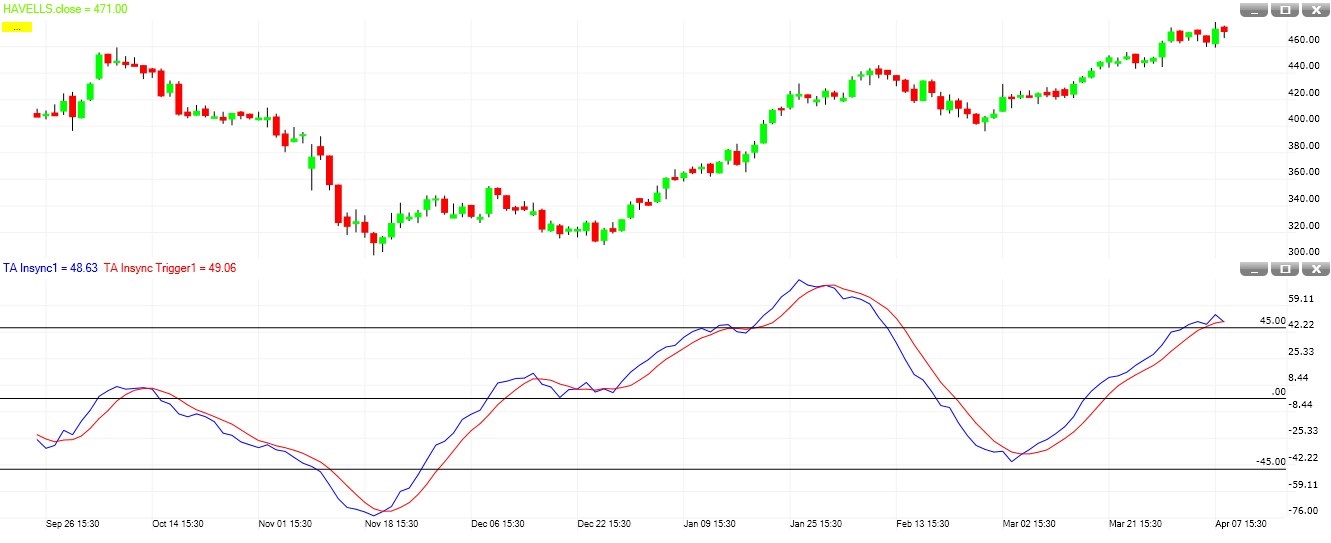
Use 55 lookback (smooth 5) as a trend indicator. Use 13 lookback (smooth 3) for buy on dips in an ongoing uptrend.
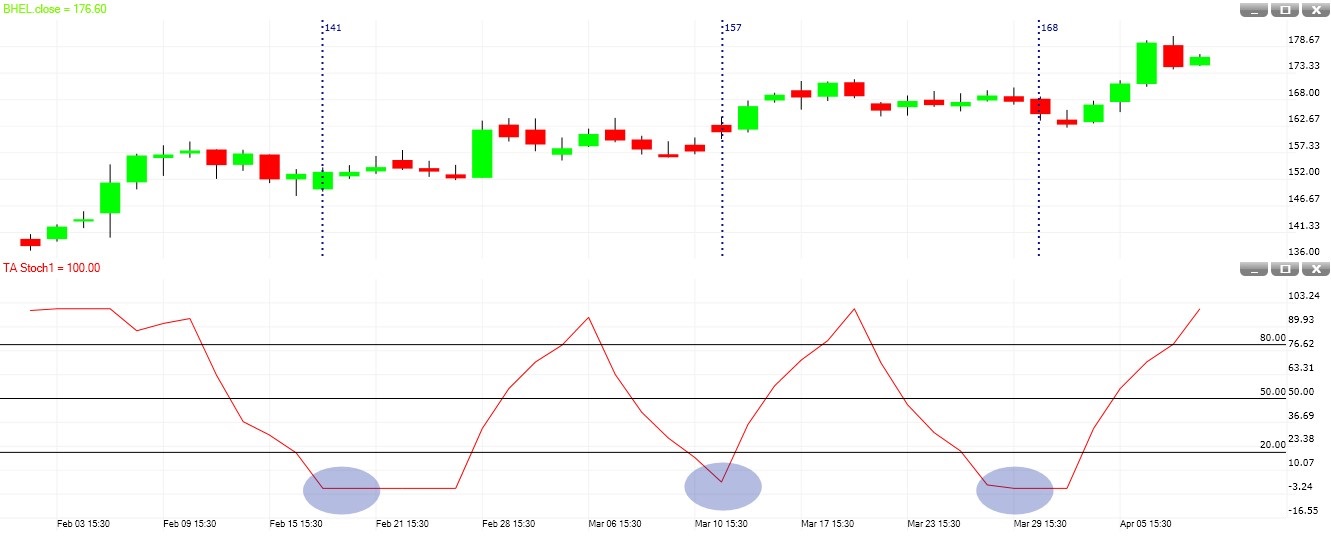
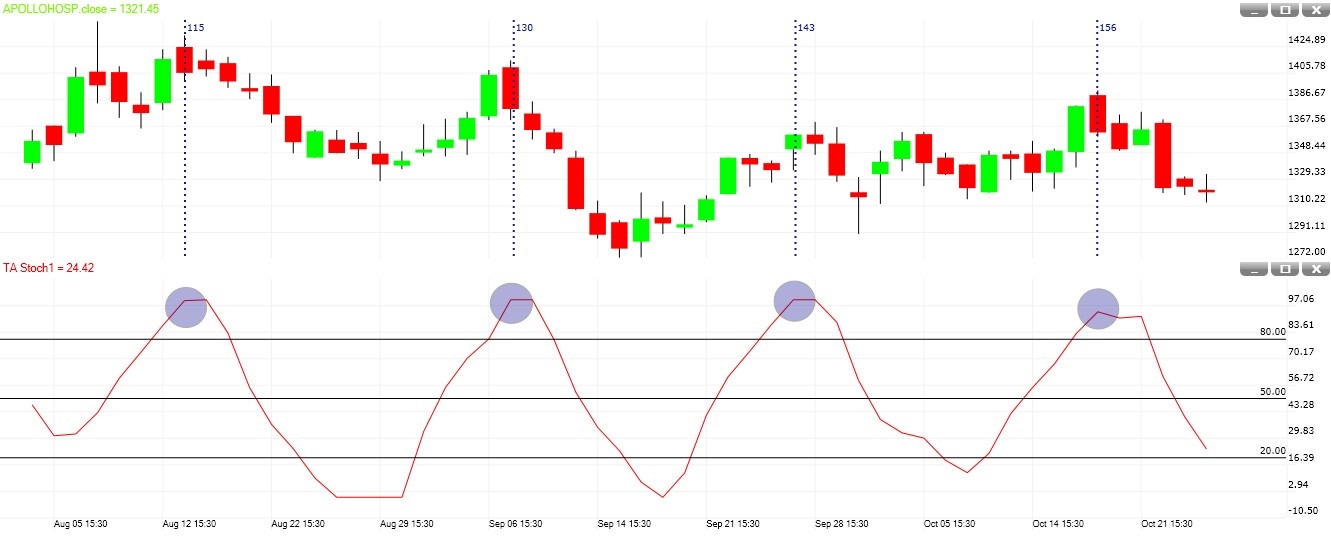
TA Stoch
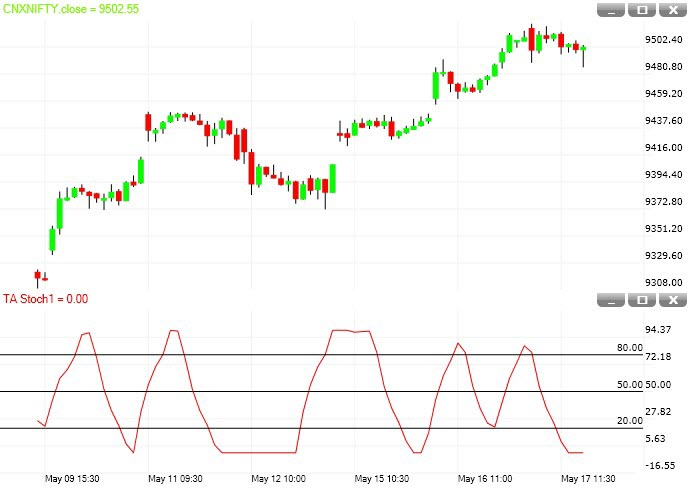
Modified stochastic. In an uptrend, stochastic often remains overbought and does not give buy-on-dip signals. TA Stoch moves faster and gives quicker signals.
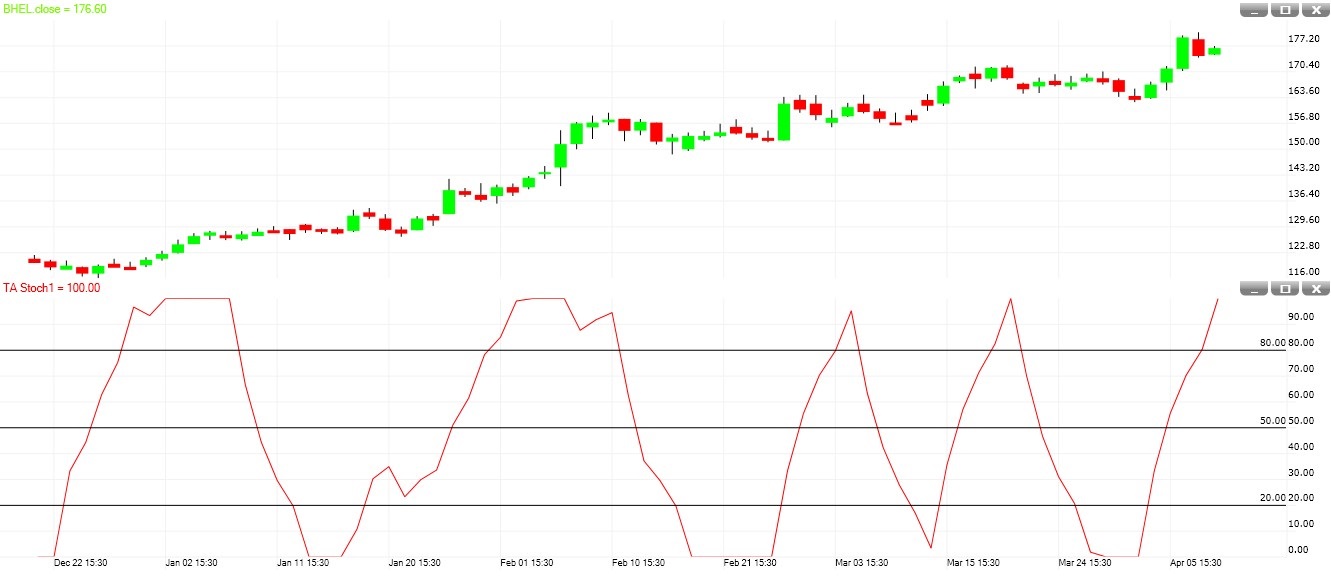
In an uptrend, buy when TA Stoch comes to 0 (short-term oversold). In a downtrend, sell when TA Stoch comes to 100 (short-term overbought). Always use with the trend.
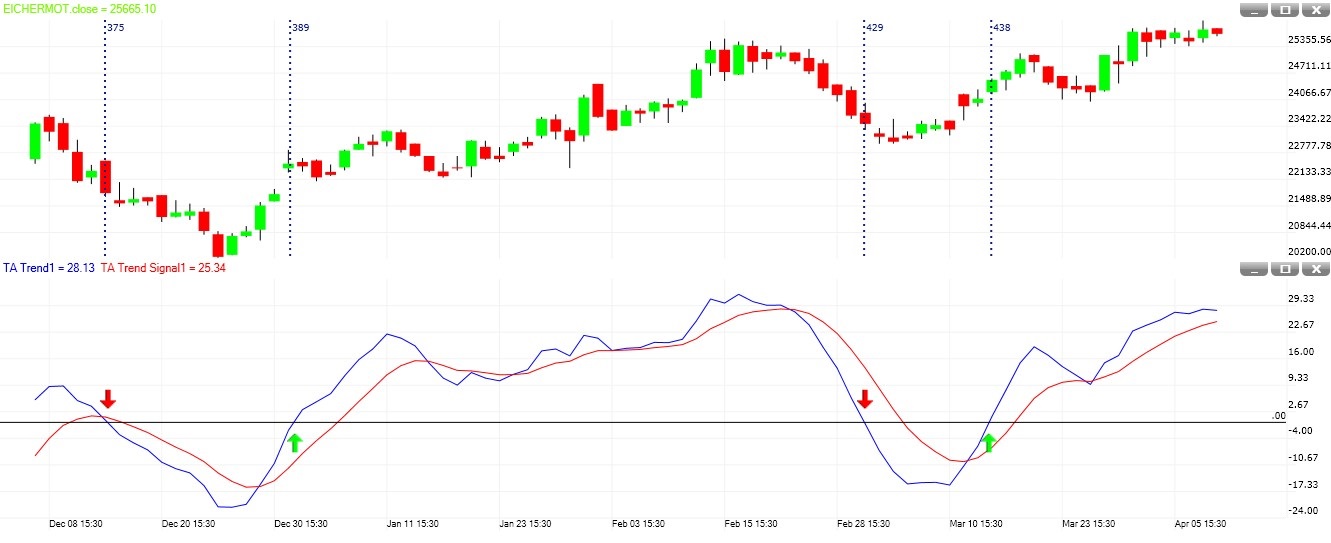
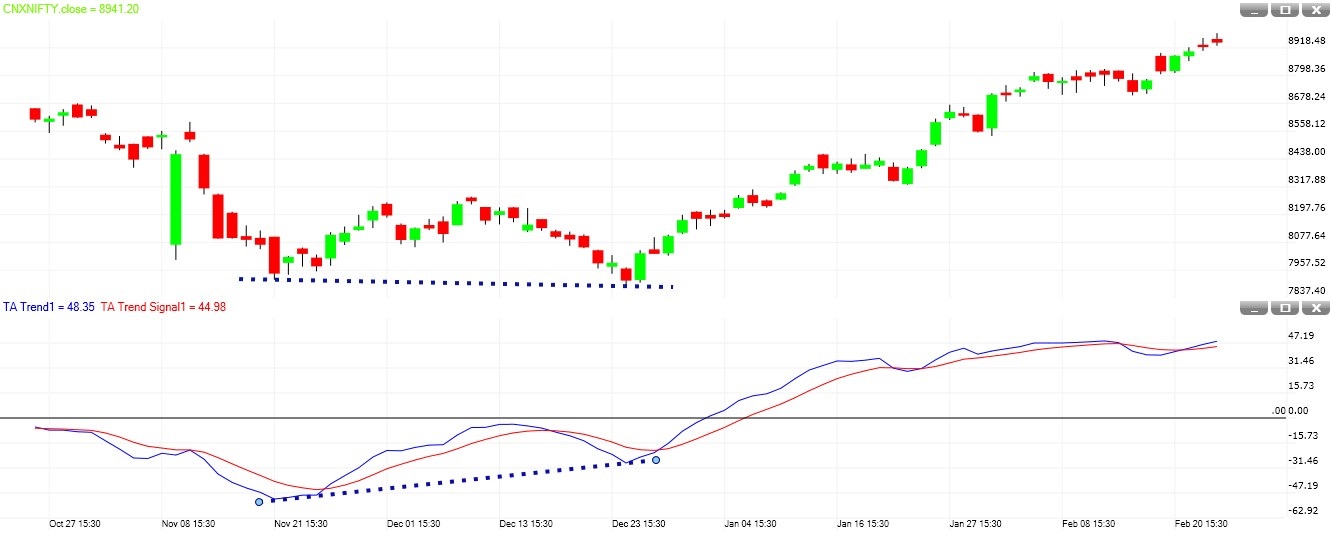
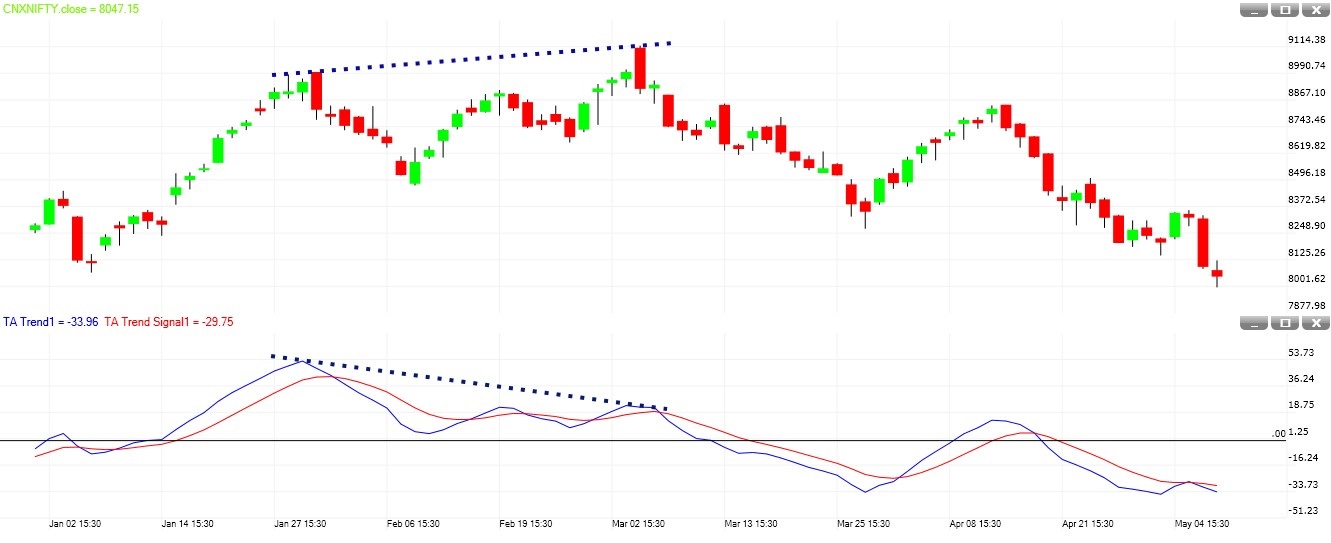
TA Trend
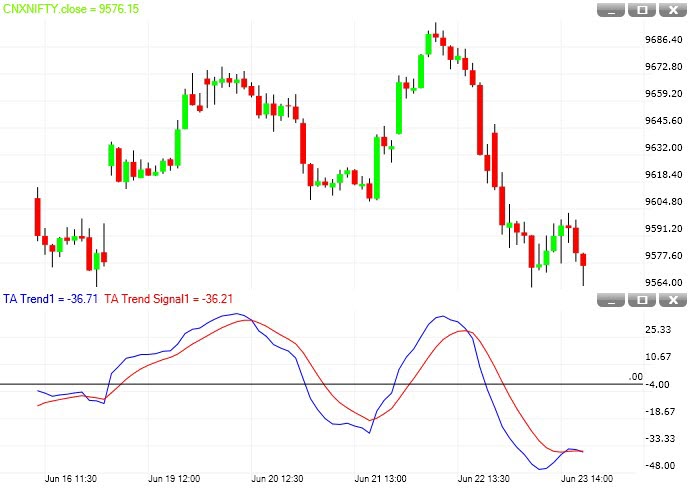
Indicates market direction and amount of movement, and highlights turning points. Applicable to intraday and longer-term horizons.
Signal line crossovers: Bullish when blue line crosses above red; bearish when blue crosses below red.
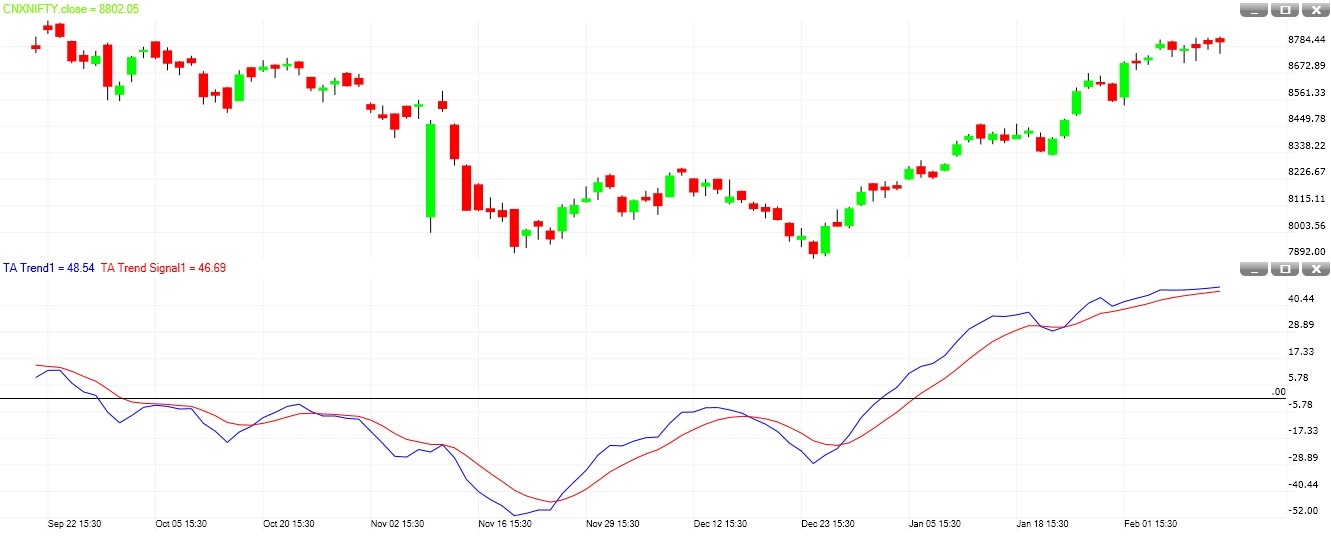
Centerline crossovers: Bullish when blue moves above zero; bearish when below zero.
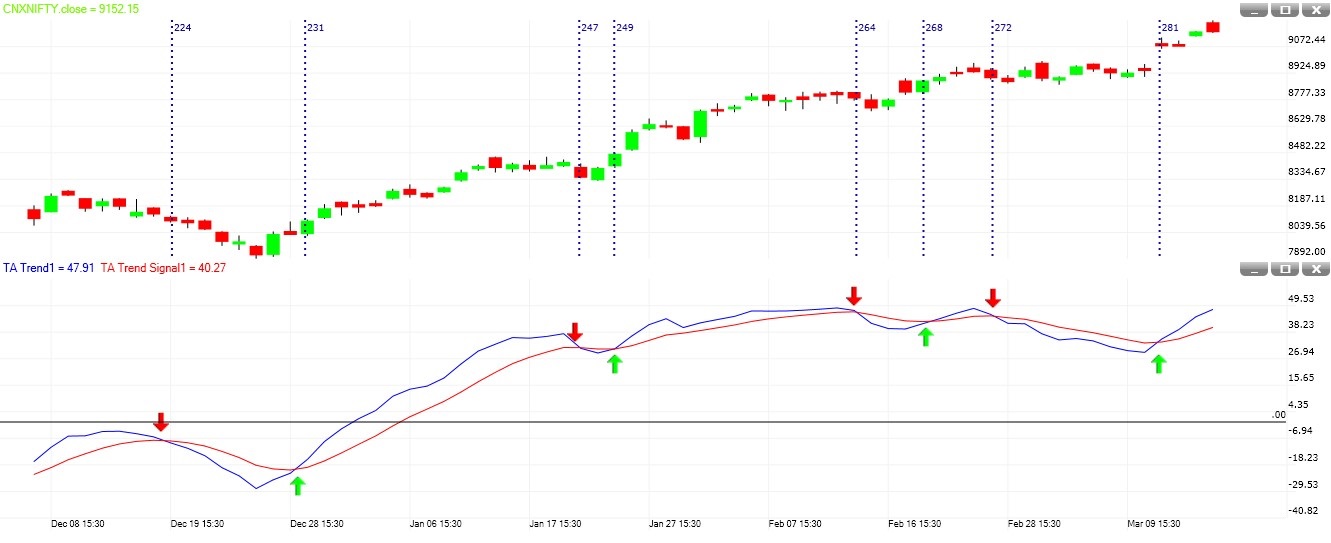
Divergences: Bullish divergence — lower low in price, higher low in indicator. Bearish divergence — higher high in price, lower high in indicator.