Trend Analyser
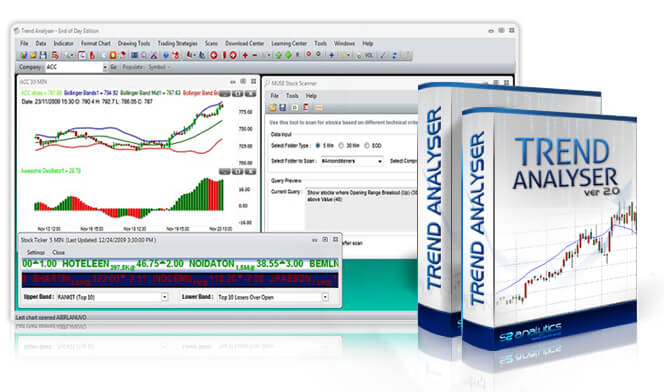
Trend Analyser is a professional charting and analysis software that comes with state-of-the-art tools to determine trend, momentum, buy and sell points for stocks.
Trend Analyser is a professional charting and analysis software that comes with state-of-the-art tools to determine trend, momentum, buy and sell points for stocks.
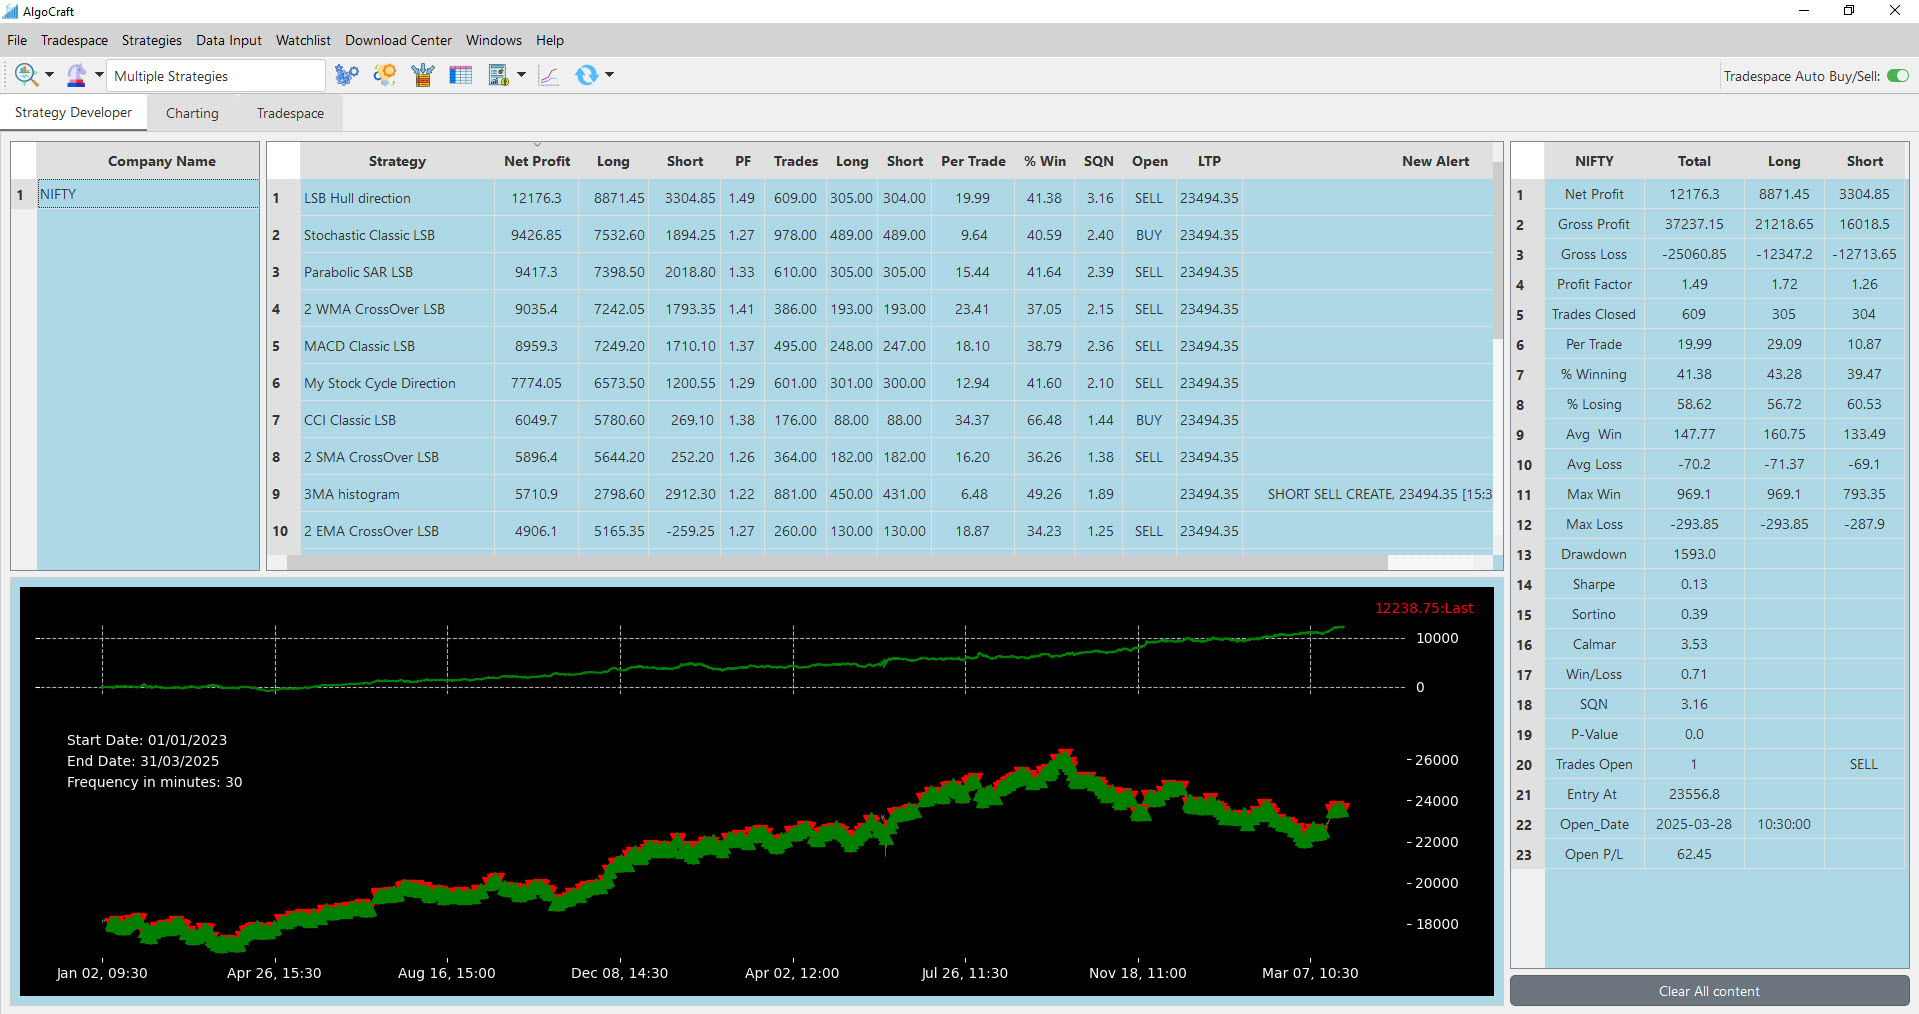
AlgoCraft empowers users to effortlessly scan and algo trade companies using built-in strategies
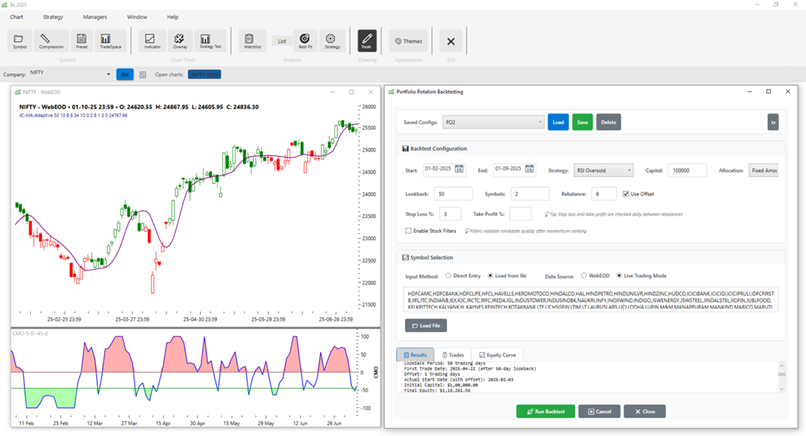
TA2025 is the next generation charting and analysis software. It is full of cutting edge tools such as enhanced charting, portfolio manager, back-testing engine, walk forward optimization and smart ma
Trend Analyser is a professional charting and analysis software that comes with state-of-the-art tools to determine trend, momentum, buy and sell points for stocks.
AlgoCraft empowers users to effortlessly scan and algo trade companies using built-in strategies
TA2025 is the next generation charting and analysis software. It is full of cutting edge tools such as enhanced charting, portfolio manager, back-testing engine, walk forward optimization and smart ma
 |
Two important tools that help you speed up the process of viewing various charts are workspace and template. Workspace: Save a group of charts together, preserving technical studies and drawings you have applied. This can be performed at the click of a button. Saves time as you don't have to open charts you view frequently and apply technical studies manually. |
|
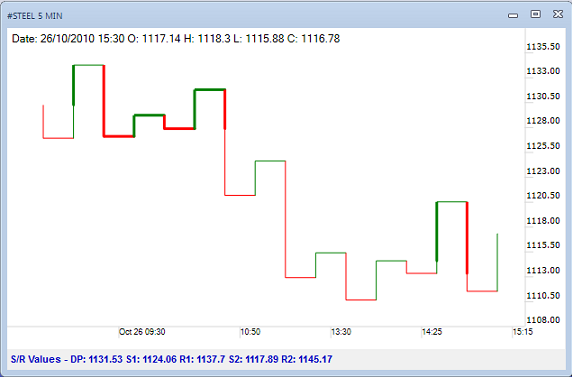
Apart from providing standard chart types like OHLC, Candle and Line chart, Trend Analyser also provides other chart types such as Kagi, Three line break, Darvas boxes, Equivolume, Equivolume shadow, Renko, Point & figure, Black & white candle, Weighted close, Heikin-Ashi and HLC. The chart on the right has chart type set to Kagi. |
|
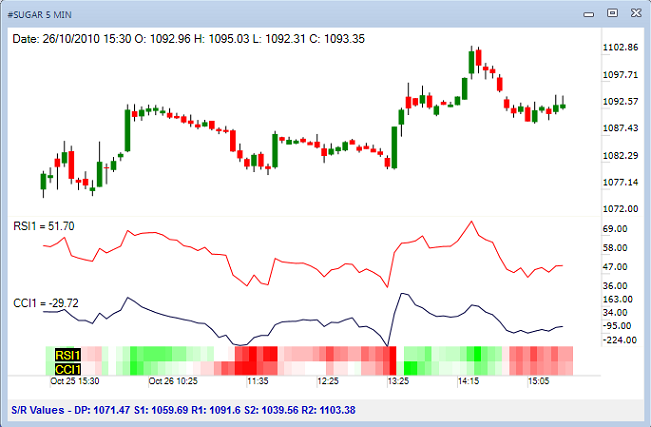 |
A unique feature of Trend Analyser is the heat map which normalizes all visible values between 0 and 1. Any values that are trending downwards is red, while values trending upwards is green. All you need to do is apply an indicator and heat map will show you the result. |
|
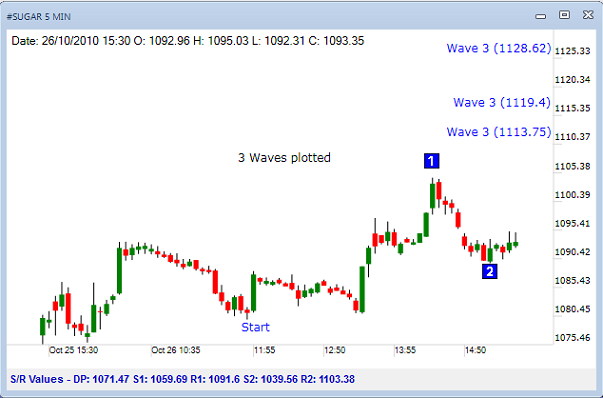
The Elliott wave principle is a form of technical analysis that investors use to forecast trends in the financial markets by identifying extremes in investor psychology, highs and lows in prices, and other collective activities. When you identify an up trend, we can apply Elliott wave up to calculate PRICE TARGETS for different waves.Elliott Waves consist of 5 waves, three impulsive (i.e. in the direction of the trend), 2 corrective (i.e. counter trend). Waves 1, 3 & 5 are impulsive waves. Waves 2 and 4 are corrective waves. Similarly plot Elliott wave down if you identify a downtrend. You can plot Elliott waves manually or let the program apply an Elliott wave automatically. |
|
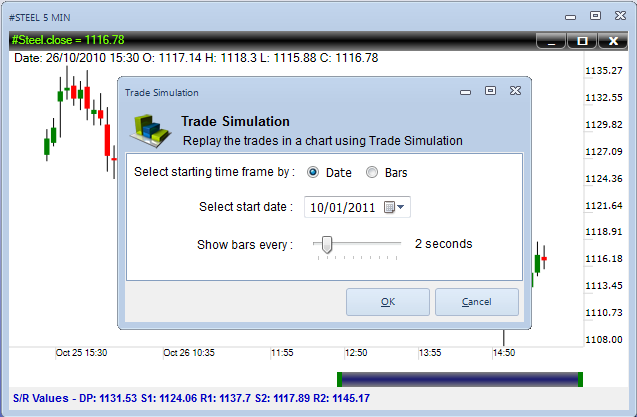 |
Trade simulation option recreates a complete real-time market picture. It is an easy way for beginners to trade markets without the risk of losing their hard earned capital. Simulator allows experienced traders to see how their trading ideas and strategies would perform under “real-time” market conditions – with no financial risk whatsoever. Trade simulation can playback market data at different speeds providing you with complete control over the speed of the market data to be displayed. |
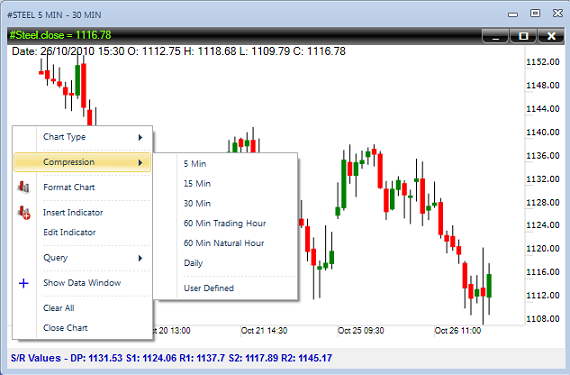
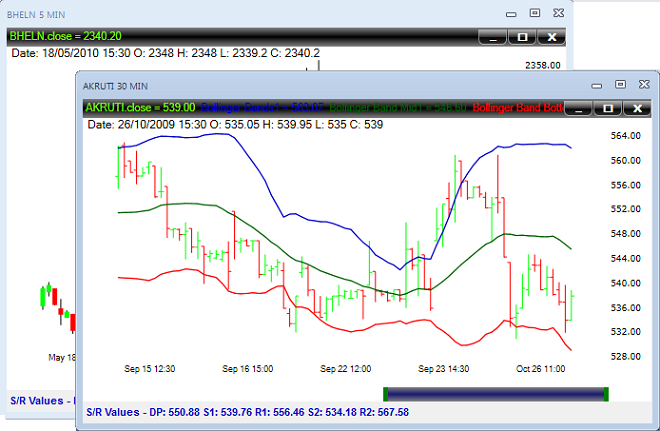
| Compress data to any interval you want. Realtime 5 min data can be compressed to 15 min, 30 min, 60 min, daily or any user defined interval. EOD data can be compressed to daily, weekly, monthly, quarterly and more. Compression converts existing data to a particular time frame which helps you to indentify trend for a different time frame. |
|
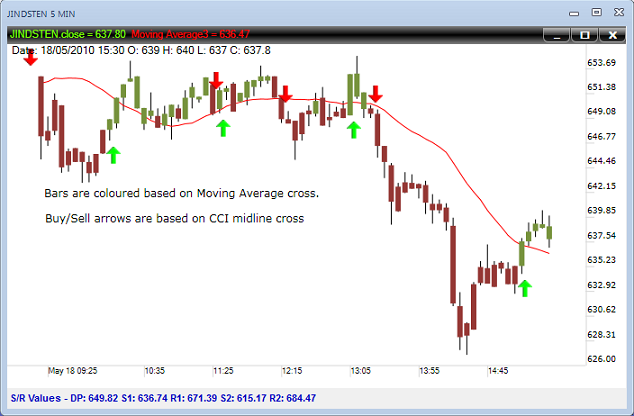 |
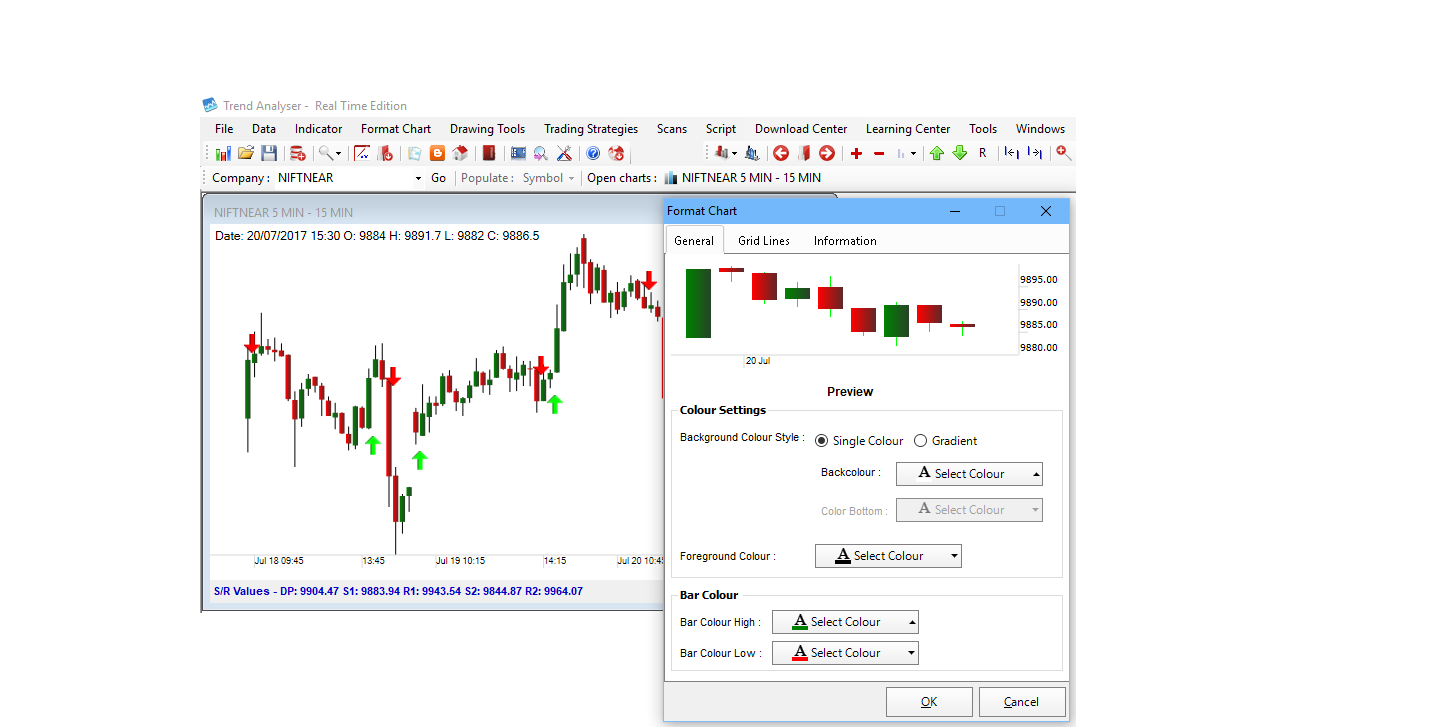
Trend paint helps you to paint bars on your chart to a different color to highlight technical criteria that you specify. For example, you will be able to quickly identify narrowest ranges on your chart as Trend Analyser will automatically display narrowest ranges bars on your chart in a different color. Trend paint allows you to either colour bars or show buy/sell arrows. Several indicators support trend paint system. For e.g. in the image on the left, a moving average trend paint has been applied and bars are coloured on that basis. And arrows are applied based on CCI indicator. |
 Pay
Pay Sign Up