Trend Analyser
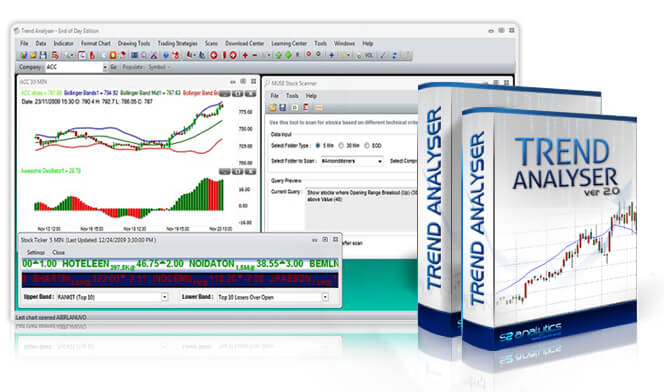
Trend Analyser is a professional charting and analysis software that comes with state-of-the-art tools to determine trend, momentum, buy and sell points for stocks.
Trend Analyser is a professional charting and analysis software that comes with state-of-the-art tools to determine trend, momentum, buy and sell points for stocks.
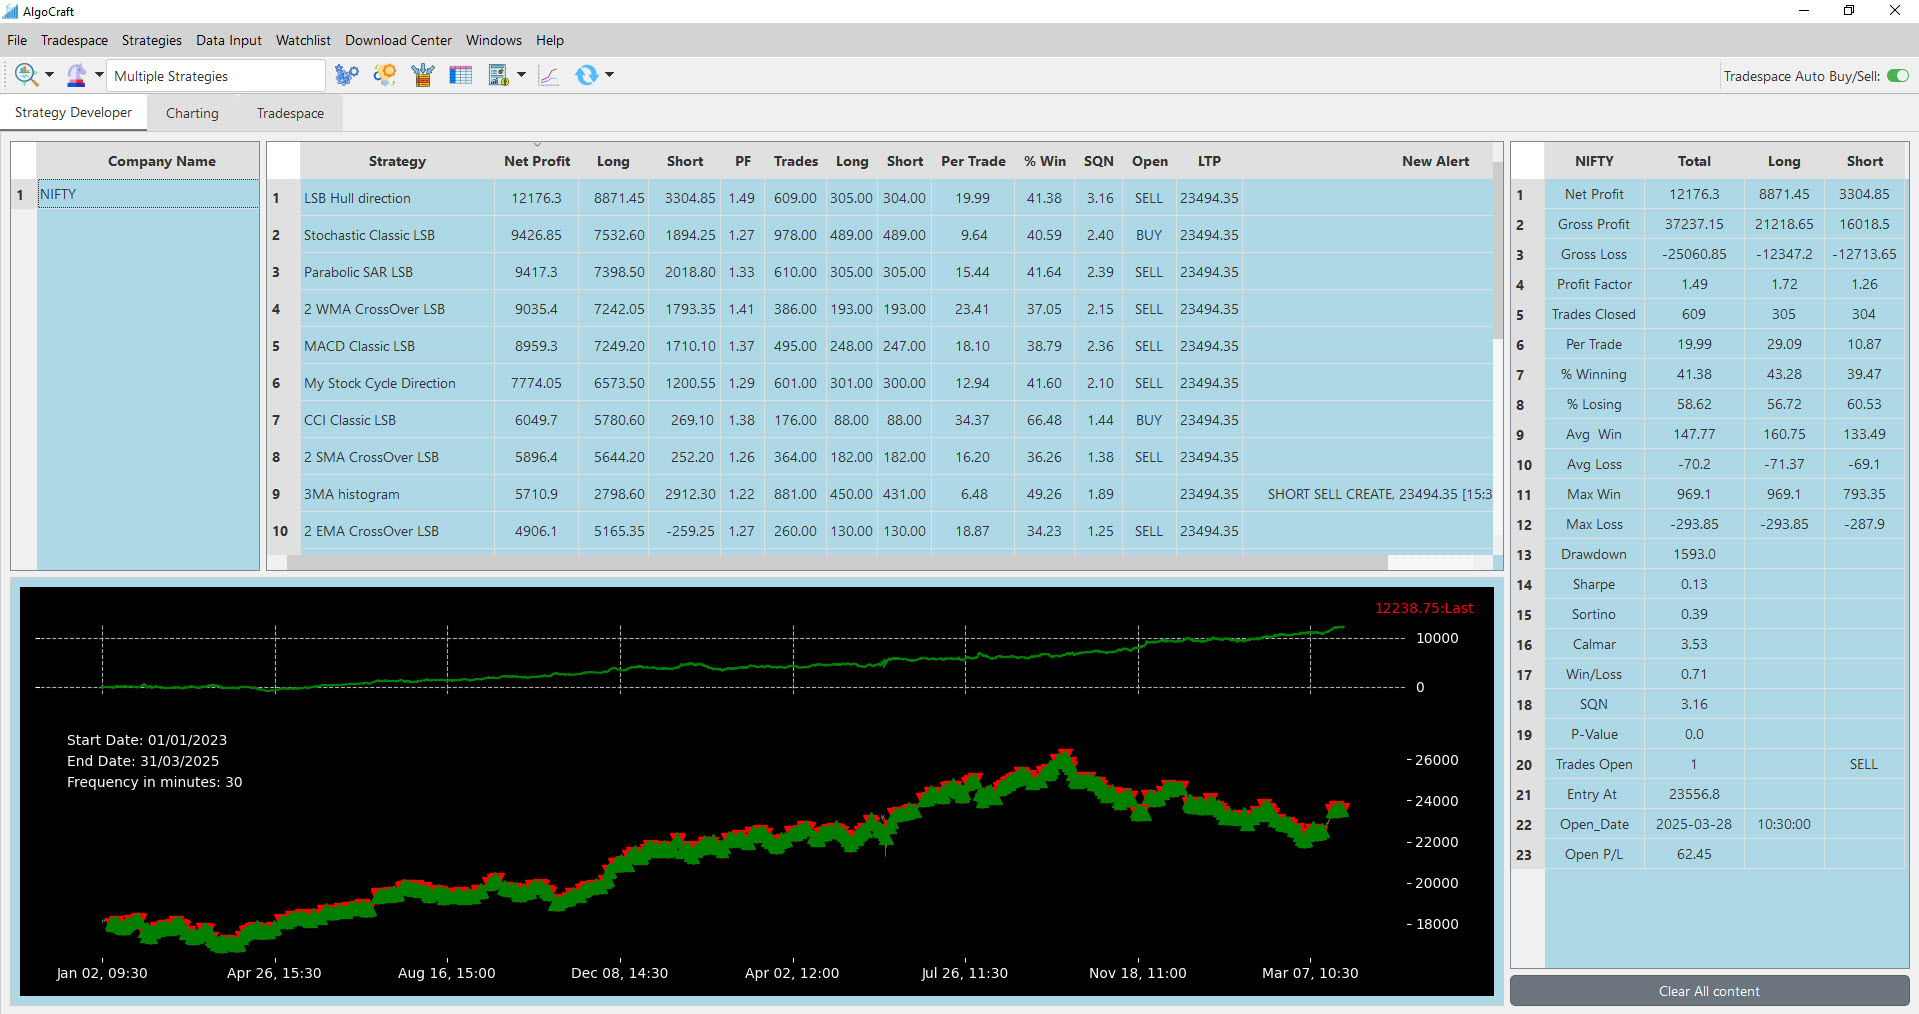
AlgoCraft empowers users to effortlessly scan and algo trade companies using built-in strategies
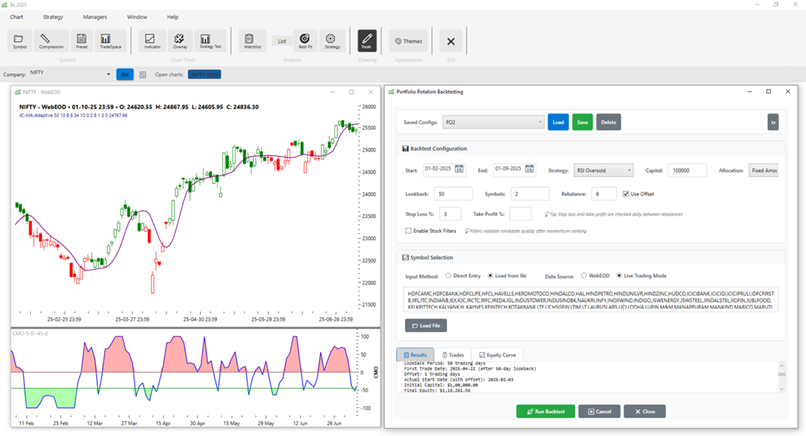
TA2025 is the next generation charting and analysis software. It is full of cutting edge tools such as enhanced charting, portfolio manager, back-testing engine, walk forward optimization and smart ma
Trend Analyser is a professional charting and analysis software that comes with state-of-the-art tools to determine trend, momentum, buy and sell points for stocks.
AlgoCraft empowers users to effortlessly scan and algo trade companies using built-in strategies
TA2025 is the next generation charting and analysis software. It is full of cutting edge tools such as enhanced charting, portfolio manager, back-testing engine, walk forward optimization and smart ma
|
Indicator Type: Adaptive Momentum Suitable for: All. Description: S2 Analytics fast response RSI |
Details: In volatile markets, momentum oscillators often give false signal and sometimes move opposite to price direction. We have made some changes in RSI indicator so it does not move random and catch the price swing effectively. |
|
Indicator Type: Adaptive Momentum Suitable for: All. Description: Oscillator with adaptive bands |
Details: S2-Momentum is an advance oscillator with an adaptive level of overbought and oversold zone. |
|
|
|
|
|
|
|
|
|
Indicator Type: Adaptive Momentum Suitable for: All. Description: Oscillator with smoothed Bands |
Details: S2-Superband is an advance oscillator with an adaptive level of overbought and oversold zone. |
|
Indicator Type: Adaptive Trend Suitable for: Swing, Positional, Investor Description: Moving Average of Multiple JMA Lines |
Details: S2-MULTI JMA uses multiple S2 JMA and then shows them in a single line. As the indicator uses a variety of MA values, so it shows how strong a trend is. |
|
|
|
|
|
|
|
|
|
Indicator Type: Adaptive Trend Suitable for: Intraday, Swing, Positional Description: Low Lag Moving Average-Single JMA Line |
Details: This MA is Smart with low lag. It create less noise while giving better timing for trend reversal. |
|
Indicator Type: Adaptive Trend Suitable for: Swing, Positional, Investor Description: Low Lag Moving Average-Double JMA Line |
Details: Moving average crossovers are a common trading system which most trader use. A bullish crossover occurs when the shorter moving average crosses above the longer moving average. This is also known as a golden cross. A bearish crossover occurs when the shorter moving average crosses below the longer moving average. This is known as a dead cross.. |
|
Indicator Type: Adaptive Trend Suitable for: Intraday, Swing Description: Jurik Clone & Dickson MA Combined |
Details: Moving average crossovers are a common trading system which most trader use. A bullish crossover occurs when the shorter moving average crosses above the longer moving average. This is also known as a golden cross. A bearish crossover occurs when the shorter moving average crosses below the longer moving average. This is known as a dead cross. |
|
Indicator Type: Adaptive Trend Suitable for: Intraday, Swing, Positional Description: Low lag Moving Average by Dickson |
Details: This MA is Smart with low lag. It create less noise while giving better timing for trend reversal. |
|
|
|
|
|
|
|
|
|
Indicator Type: Adaptive Trend Suitable for: Intraday, Swing, Positional Description: LowLow lag Jurik Moving Average Clone |
Details: This MA is Smart with low lag. It create less noise while giving better timing for trend reversal. |
|
Indicator Type: Adaptive Volatility & Momentum Suitable for: Intraday, Swing Description: %B Smoothed |
Details: This indicator is adaptive in nature based on bollinger Band. It works as an oscillator which helps identifying swing high low or overbought oversold markets. |
|
|
|
|
|
|
|
|
|
Indicator Type: Volume Suitable for: Swing, Positional, Investor Description: Twiggs Money Flow Indicator |
Details: Twiggs Money Flow warns of breakouts and provides useful trend confirmation. |
|
|
|
Indicator Type: Volatility Suitable for: All Description: Acccum Dist Ind line Plot like Histogram |
Details: The Accumulation Distribution Line is a volume-based indicator designed to measure the cumulative flow of money into and out of a security. The Accumulation Distribution Line is a cumulative measure of each period’s volume flow, or money flow. |
|
Indicator Type: Volatility Suitable for: All Description: Plot Average Trading Price |
Details: Average traded price, also referred to as volume-weighted average price, is what buyers have paid for one share on average, over the course of a specific time period. |
|
|
|
|
|
|
|
|
|
Indicator Type: Pivots Suitable for: Intraday Description: Standard camarilla Pivot for Current Day |
Details: Key levels for a reversal or breakout for the next day. |
|
Indicator Type: Pivots Suitable for: Intraday Description: Standard camarilla Pivot |
Details: Key levels for a reversal or breakout for the same day. |
|
|
|
|
|
|
|
|
|
Indicator Type: Trend Suitable for: Swing, Positional, Investor Description: Hull Moving Average |
Details: The Hull Moving Average (HMA) is an extremely fast and smooth moving average. In fact, the HMA almost eliminates lag altogether and manages to improve smoothing at the same time. |
|
Indicator Type: Volatility & Momentum Suitable for: Intraday, Swing Description: SuperTrend Indicator |
Details: Supertrend indicator is a combination of momentum and volatility. This indicator helps you to ride the trend once it established. |
|
|
|
|
|
|
|
|
|
Indicator Type: Price Suitable for: All Description: Plots the sum of two script with indicator TA Insync and MA |
Details: Plots the sum of two script with indicator TA Insync and MA. |
|
Indicator Type: Price Suitable for: All Description: Plots the Difference of two script with indicator TAInsync and MA |
Details: Plots the Difference of two script with indicator TAInsync and MA. |
|
Indicator Type: Trend Suitable for: Swing, Positional Description: TA Trend Indicator |
Details: TA Trend indicator not only indicates the direction of the market as well as the amount of the movement of the market but also highlights market turning points. It is a sophisticated technical indicator that can help you identify shorter-term swings while staying in sync with the trend. |
|
Indicator Type: Trend & Momentum Suitable for: Swing, Positional, Investor Description: Two RSI Indicator with Different Value |
Details: Plots two RSI Indicator lines with different value together. |
|
|
|
|
|
|
|
|
|
Indicator Type: Trend Suitable for: Swing, Positional, Investor Description: Moving Average with Optional Trigger Line |
Details: Plots two line together on the chart. First is MA and then we have given an option to create a MA of the MA. |
|
Indicator Type: Momentum Suitable for: Intraday, Swing Description: TA Stoch Indicator |
Details: This is a modified version of stochastic. TA stoch moves quickly compare to Stochastic and very helpful in cathing the smal swings. |
|
|
|
|
|
|
|
|
|
Indicator Type: Trend & Momentum Suitable for: All Description: TA Insync Indicator |
Details: TA Insync combines the best of trend as well as momentum indicators and helps traders determine extreme levels of stock prices. It shows when a majority of indicators are in sync, suggesting that a turning point is near. |
|
|
|
Indicator Type: Momentum Suitable for: Swing, Positional Description: Schaff Trend Cycle Indicator |
Details: The STC indicator is a forward-looking, leading indicator, that generates faster, more accurate signals than earlier indicators, such as the MACD because it considers both time (cycles) and moving averages. |
|
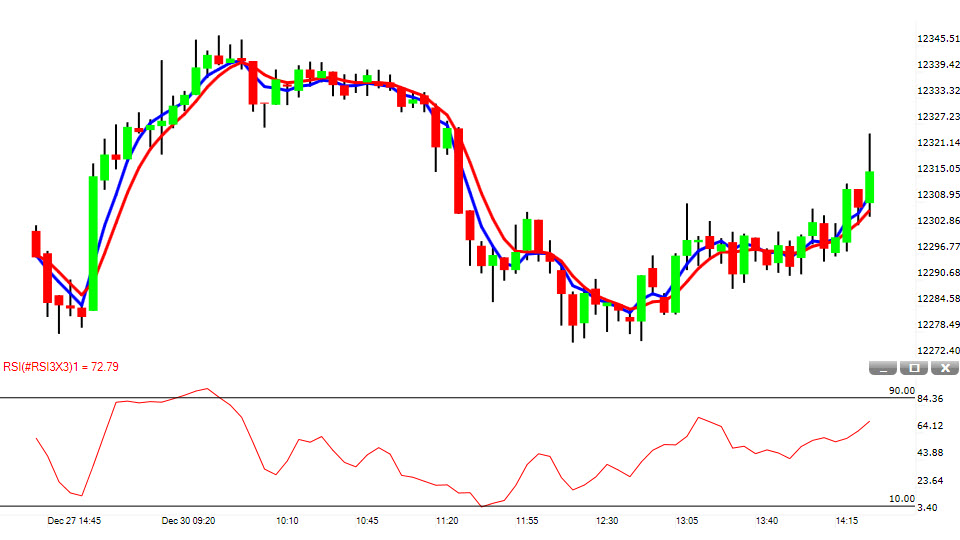
Indicator Type: Momentum Suitable for: Intraday Description: RSI Period 3 with Smooth 3 |
Details: Classic RSI Indicator with Modified value which is more suitable for intraday traders to identify a dip to buy and a rally to sell. |
|
|
|
|
|
|
|
|
|
Indicator Type: Trend Suitable for: Swing, Positional Description: Three Moving Averager Line CrossOver |
Details: The indicator plots three moving average with different value and type. |
|
Indicator Type: Trend Suitable for: Swing, Positional Description: Two Moving Averager Line CrossOver |
Details: The indicator plots two moving average with different value and type. |
|
|
|
|
|
|
|
|
|
Indicator Type: Trend & Momentum Suitable for: Positional, Investor Description: Guppy Multiple Moving Average Indicator |
Details: The Guppy Multiple Moving Average (GMMA) Indicator provides an interesting alternative to using any variable you like. The GMMA implements 12 different exponential moving averages (EMAs) in an effort to analyse a market’s behaviour on multiple levels. Guppy groups the EMAs into two categories. The first six are considered short-term (green color MA) and the other six are considered long-term (red color MA). The long-term EMAs represent the interests and behaviours of investors that have taken a long-term approach to a given market. The short-term EMAs represent traders, or speculators, who are attempting to capture short-term profits. Uptrend: When slope of all the lines are upward. Downtrend: When slope of all the lines are downward. |
|
|
|
|
|
|
|
|
|
Indicator Type: Volatility Suitable for: Swing, Positional, Investor Description: Alligator Indicator |
Details: The Alligator is a set of three smoothed moving average lines. The Alligator as being like a compass which keeps your trading in the right direction. The Alligator helps you spot a real trend and stay out of range-bound trading, which always result in losses. The Alligator is the combination of three balance lines viz., the blue line (alligator's jaw), the red line (alligator's teeth) and the green line (alligators lips). |
|
Indicator Type: Trend & Momentum Suitable for: Intraday, Swing Description: 2 MA Difference Indicator |
Details: Plots the difference of two MA's. The indicator suggets a trend as well the current momentum. |
|
Indicator Type: Volatility Suitable for: Swing, Positional, Investor Description: Simple Moving Average Band |
Details: Plots three lines in a chart. Middle line tells the direction of a trend. Upper and Lower Bands used to signal price breakouts and give overbought and oversold readings. |
|
Indicator Type: Volatility Suitable for: Intraday, Swing Description: Bollinger Bands %B Indicator |
Details: This indicator is based on bollinger Band. It works as an oscillator which helps identifying swing high low or overbought oversold markets. |
|
|
|
|
|
|
|
|
 Pay
Pay Sign Up